Every industry describes its data problem in its own dialect. A plant manager talks about lines and shifts, a merchandiser about SKUs and stores, a hospital CIO about encounters and charts, a bank about positions and counterparties. Put the four in the same room and the vocabulary stops matching almost immediately. Data and AI by industry looks, from the outside, like four different disciplines.
It rarely is. Underneath the vocabulary, the four share one structure: operational data is produced by a system that was never designed to hand it over, and the analytical work starts by getting it out intact. McKinsey's State of AI 2026 survey found that 88% of organizations now use AI in at least one business function while only about a third have begun to scale it, and the gap is almost never about the model. It is about whether the data arrives complete, on time, and with enough context to be trusted.
What genuinely differs between sectors is the set of constraints wrapped around that structure: how fast the data has to move, which artifact a regulator will ask to see, how many distinct things you are counting, and how long you have to keep the evidence. Get those four right and most of the architecture follows. This guide walks through manufacturing, retail, healthcare and financial services, names the constraint that dominates each one, and points to the deeper material on each.
Four industries, one shape of problem
Strip the jargon and the same five steps appear in every sector project. Something operational happens, and a source system records it in a schema optimized for writing rather than reading. From there a capture layer moves it, usually with some loss along the way. Then a modeling layer gives it business meaning, and only at the end does a decision consume it, either as a dashboard or as a model output.
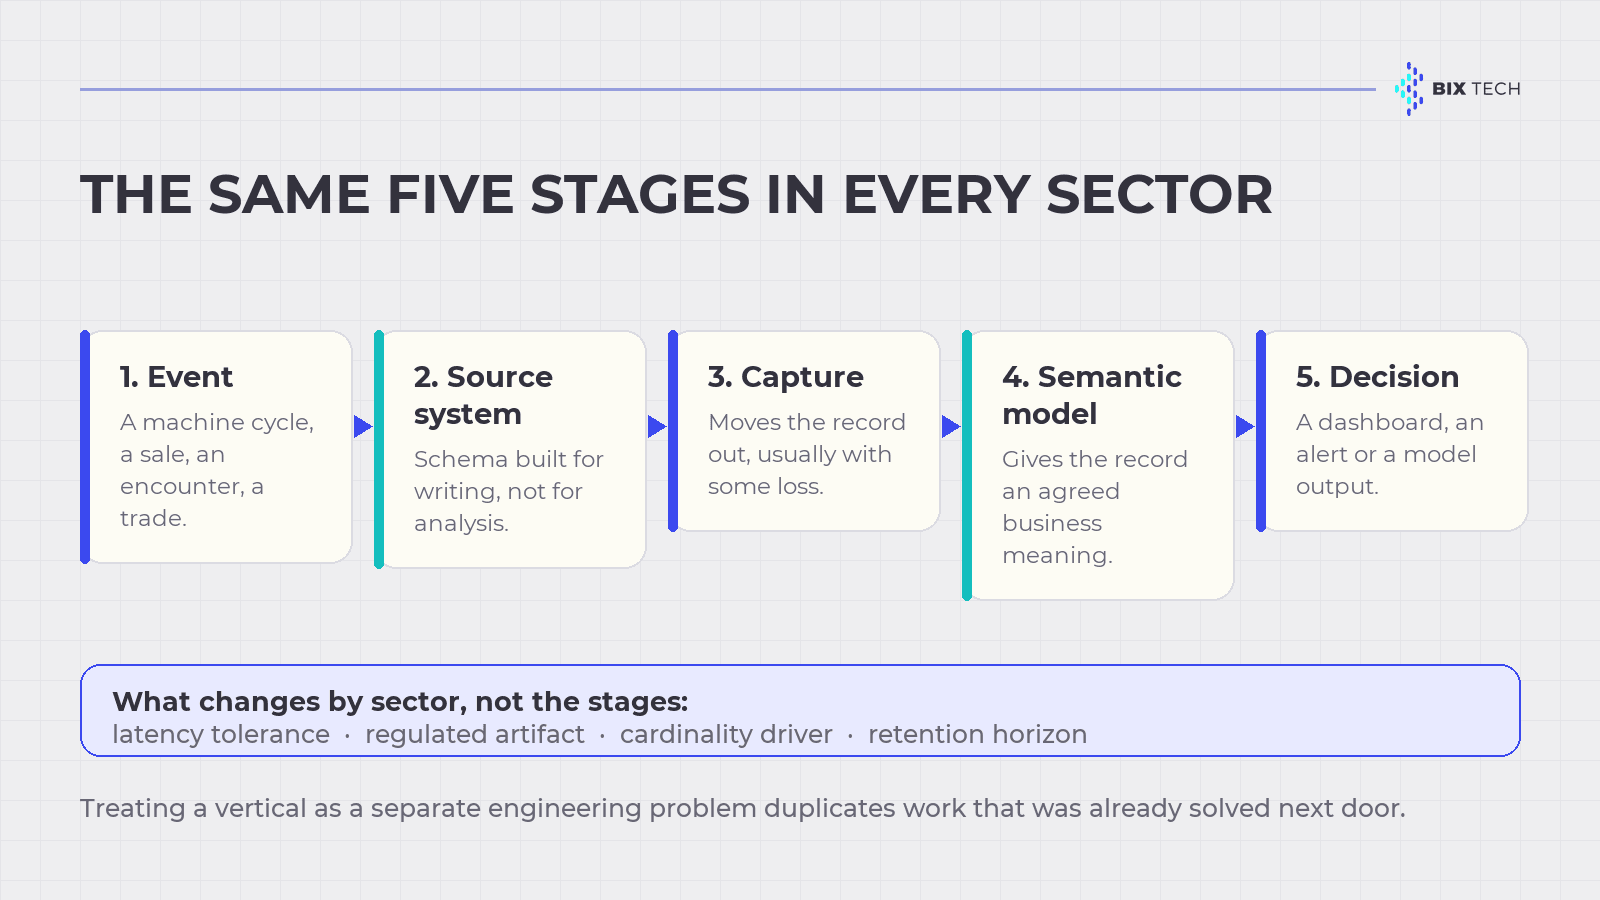 The shared pipeline behind manufacturing, retail, healthcare and financial services. Source: BIX Tech.
The failure modes repeat too. Capture drops fields nobody noticed were load-bearing. Two teams define the same metric differently and both are defensible. A model trained on last year's mix degrades quietly because nothing watches for drift. None of that is sector-specific, which is why treating a vertical as a wholly separate engineering problem tends to duplicate work that was already solved next door.
The part that is genuinely sector-specific is narrower than most vendors suggest. It comes down to four constraints, and they are worth naming explicitly before looking at any individual industry.
| Constraint | What it decides | Cheapest time to settle it |
|---|---|---|
| Latency tolerance | Streaming versus batch, and how much buffering the pipeline can afford | Before choosing the capture layer |
| Regulated artifact | What an auditor asks to see: lineage, change log, consent, model version | At schema design |
| Cardinality driver | Partitioning, index strategy and storage cost | Before the first production load |
| Retention horizon | Storage tiering and how far back a model can be trained or replayed | Before data is deleted for the first time |
Manufacturing: the data is trapped at the edge
Plant data is produced by PLCs, SCADA systems and historians that predate the analytics stack by a decade or more, and often by design cannot be queried from outside the plant network. The dominant constraint is latency: a quality deviation that takes four hours to surface has already produced four hours of scrap.
Most plants converge on a publish-subscribe layer that decouples producers from consumers, commonly organized along the ISA-95 hierarchy of enterprise, site, area, line and cell. The OPC Foundation and MESA publish an OPC UA companion specification for ISA-95 that represents equipment, personnel, material and physical assets as native OPC UA objects, which is what allows the same model to reach from Level 2 automation up to MES and ERP without a bespoke translation at every hop.
Two practical cautions follow. First, tag names on the floor are rarely stable or meaningful, so the mapping from tag to business entity has to be versioned like code rather than maintained in a spreadsheet. Second, historians compress aggressively, and a model trained on compressed history will not see the transients that predict failure. Check the compression settings before concluding that a signal is absent.
Manufacturing also has the clearest payback pattern of the four, because the counting unit is unambiguous: scrap rate, unplanned downtime minutes, or margin per unit. That makes it the easiest sector in which to defend a data investment, and the hardest in which to hide a vague one.
Retail: the identifier keeps changing
Retail's dominant constraint is cardinality. A mid-size chain tracking every product, at every location, at daily grain, across promotions and channels, produces a fact table that grows faster than most first architectures assume. Add returns, substitutions and marketplace listings and the identifier itself starts moving: the thing you are counting changes definition mid-year.
That identifier problem is about to get a useful push. GS1's Sunrise 2027 initiative prepares point-of-sale systems to accept 2D barcodes carrying the GTIN plus batch, expiry and variant data through GS1 Digital Link. For data teams the significance is less about the barcode and more about what it implies: item-level attributes that used to live in a master data spreadsheet start arriving with the transaction.
Forecasting is where the cardinality bill comes due. A model per SKU per store is usually unaffordable and usually unnecessary; hierarchical approaches that forecast at an aggregated level and allocate downward tend to hold up better under sparse data. The judgment call is where to draw the aggregation line, and that is a business question about substitutability, not a modeling one.
Retail is also the sector where the semantic layer earns its keep fastest, because "units sold" has at least four defensible definitions depending on how returns, cancellations and internal transfers are treated. Settling those definitions once, in a modeled layer, prevents the weekly reconciliation meeting that most retail analytics teams eventually inherit.
Healthcare: the record is the regulated asset
In healthcare the dominant constraint is the regulated artifact. The clinical record is simultaneously the operational system, the legal evidence and the training data, and the same field cannot be reshaped freely in all three roles. Interoperability has largely standardized on HL7 FHIR, with the US Core implementation guide mapping the USCDI data classes that certified health IT has to support, so the exchange format is mostly a solved problem. What remains hard is provenance and consent.
Model governance is further along here than in any other sector, which makes it worth borrowing from. The FDA maintains a public list of AI-enabled medical devices it has authorized, heavily concentrated in radiology, and its guidance on predetermined change control plans asks manufacturers to declare in advance which model modifications they intend to make, how they will validate them, and what the impact assessment looks like. The agency notes that the list is not comprehensive, so it is a directional signal rather than a census.
That predetermined change control idea generalizes well beyond medical devices. Declaring the allowed envelope of model change up front, with the validation method attached, is a cheaper discipline than re-approving every retrain, and it works just as well for a credit model or a demand forecast.
The operational trap in healthcare is de-identification performed too late. Once identifiable data has spread into analytical copies, retrofitting the boundary is expensive and rarely complete. Draw it at ingestion, and keep the re-identification key in a separately governed store.
Financial services: the audit trail is the deliverable
Banks and insurers hit the regulated-artifact constraint from a different angle: the obligation attaches to the trail rather than the record. In the European Union, DORA has applied since January 2025 and requires financial entities to maintain a register of information covering every ICT third-party arrangement, report major ICT incidents on a standardized classification, and submit to an EU-wide oversight framework for critical providers, according to EIOPA. Concentration risk in the data stack became a reportable fact rather than an architectural opinion.
Practically, that raises lineage from a nice-to-have to a deliverable. If a regulator asks which upstream feed produced a number in a report, the answer has to be reconstructable without a forensic exercise, which means column-level lineage captured by the pipeline rather than documented after the fact. The same applies to model inputs: a credit or fraud decision needs the feature values as they were at decision time, not as they are today.
Latency in financial services splits cleanly. Fraud and payments need sub-second decisions on a narrow feature set; risk, finance and regulatory reporting need completeness and reproducibility more than speed. Trying to serve both from one pipeline is a common and expensive mistake, and the usual resolution is a streaming path with a small, strictly versioned feature set alongside a batch path that owns the official numbers.
Retention is the quiet cost driver. Reporting obligations that run to five or seven years, combined with the need to replay a model as it stood on a given date, make tiering and immutable snapshots an architectural decision rather than a storage detail.
What data and AI by industry really changes
Set the four side by side and the pattern is easier to act on. The pipeline shape holds; the constraint that dominates shifts, and with it the decision you cannot afford to defer.
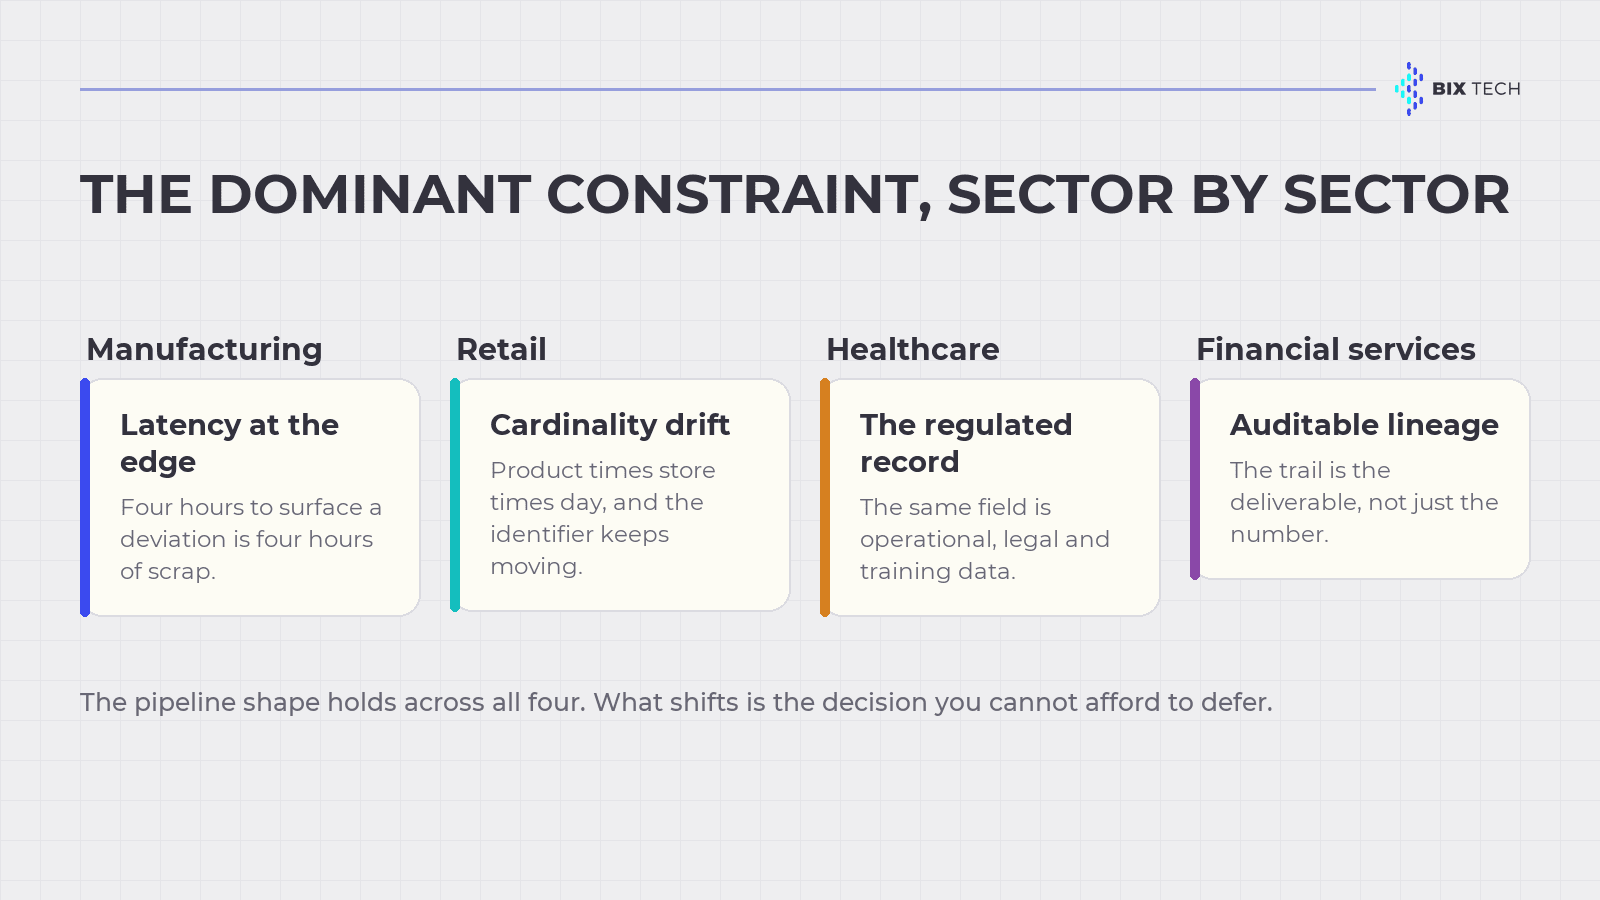 The dominant constraint per sector and the decision it forces. Source: BIX Tech.
| Sector | Dominant constraint | Decide first | Most common failure |
|---|---|---|---|
| Manufacturing | Latency at the edge | Capture layer and tag-to-entity mapping | Historian compression hides the signal |
| Retail | Cardinality and identifier drift | Forecast grain and metric definitions | Reconciliation debt from undefined metrics |
| Healthcare | Regulated record and consent | De-identification boundary at ingestion | Identifiable data spread across copies |
| Financial services | Auditable lineage | Lineage capture and point-in-time features | Two pipelines answering the same question |
A regulated sector is not automatically the harder one. Healthcare and financial services arrive with the governance requirement stated explicitly, which in practice means it gets funded. Manufacturing and retail often carry the same exposure without the deadline, and the discipline shows up later and costs more. Borrowing the regulated sectors' habits early, especially versioned models and captured lineage, is cheaper than discovering the need during an incident.
The other transferable lesson runs the opposite direction. Manufacturing's insistence on a countable unit, scrap or downtime or margin per unit, is the discipline the other three most often lack. A healthcare or banking programme that cannot name the unit it moves tends to stall at pilot regardless of how sound the architecture is.
Where to go deeper
Manufacturing and industrial operations. The plant-floor material starts with data analytics in manufacturing for the overall picture, then data management in manufacturing for how the operational layer is organized. For the analytical work itself, the guide to custom dashboards for manufacturing teams covers diagnostic analytics on line data, and predictive analytics for price prediction covers the forecasting side. On automation and AI specifically, there is intelligent industrial automation, the practical guide to AI agents in manufacturing, and the broader view in Industry 4.0 solutions and artificial intelligence in industry.
Scaling from pilot to production. Two pieces deal with the transition that most sector programmes stall on: the playbook for scaling from prototype to mass manufacturing, and cloud solutions for manufacturing for the infrastructure question underneath it. The reference architecture in MLOps for model deployment and monitoring covers the model lifecycle that the change-control idea above maps onto.
Healthcare and financial services. For the clinical side, artificial intelligence in healthcare covers advances, limits and responsible use. On the financial side, financial forecasting that works deals with the modeling, and Kubernetes operators for banking data pipelines with safe automation under audit. Both sectors depend on the controls described in cybersecurity for data pipelines, and on turning paper and scans into usable records, which is the subject of the document AI pipeline guide.
Other verticals. Two more sectors have their own material worth reading for the pattern rather than the domain: AI in game development, with the companion pieces on the hidden technical costs of fast MVPs and the Unity pricing change, and artificial intelligence in agriculture. For the cross-sector view of how analytics and AI fit together, start from data analytics and AI.
Choosing a sector-specific platform before naming the dominant constraint is how most of these programmes acquire cost they cannot unwind. The vertical accelerator that ships with pre-built plant KPIs or pre-built claims models is genuinely useful once the capture layer, the metric definitions and the lineage are settled, and expensive before that, because it encodes assumptions nobody has checked. Name the constraint, settle the four decisions in the table, and the platform question becomes much smaller than it first appears.
If your operation is building out analytics or AI in a specific vertical and the sector-specific vendor pitches are starting to look interchangeable, our specialists can help map the constraints that actually apply to your context before the architecture is locked in. Talk to our team and move your data maturity forward.

Frequently asked questions about data and AI by industry
What does data and AI by industry actually mean?
It means adapting a common data architecture to the constraints of a specific vertical rather than building a different architecture per vertical. The pipeline stages are the same everywhere. What changes is latency tolerance, which artifact a regulator inspects, how many distinct entities you count, and how long you retain evidence.
Which industry is furthest along with AI?
Financial services and healthcare tend to lead on governance maturity because regulation forces the issue, while manufacturing leads on measurable payback because its counting units are unambiguous. McKinsey's State of AI 2026 survey puts overall adoption at 88% of organizations with roughly a third scaling, and the sector differences show up mainly in what gets scaled rather than in who has started.
Do we need a vertical-specific data platform?
Usually not as the first purchase. A vertical accelerator encodes assumptions about metrics, hierarchies and compliance that are valuable once your own definitions are settled and costly before that. Settle the capture layer, the metric definitions and the lineage first, then evaluate whether the accelerator saves real work.
How is AI governance different in regulated sectors?
Regulated sectors require the change process to be declared in advance rather than documented afterwards. The FDA's predetermined change control plans ask device makers to state which model modifications are allowed and how each will be validated, and DORA requires financial entities to keep a register of ICT third-party arrangements and report major incidents on a standard classification.
Where should a sector data project start?
Start by naming the dominant constraint and the counting unit. The constraint decides the capture and storage design; the counting unit, whether it is scrap rate, forecast error, time to result or loss avoided, decides whether the project can be defended at the next budget cycle. Architecture choices made before those two are settled usually get reversed.