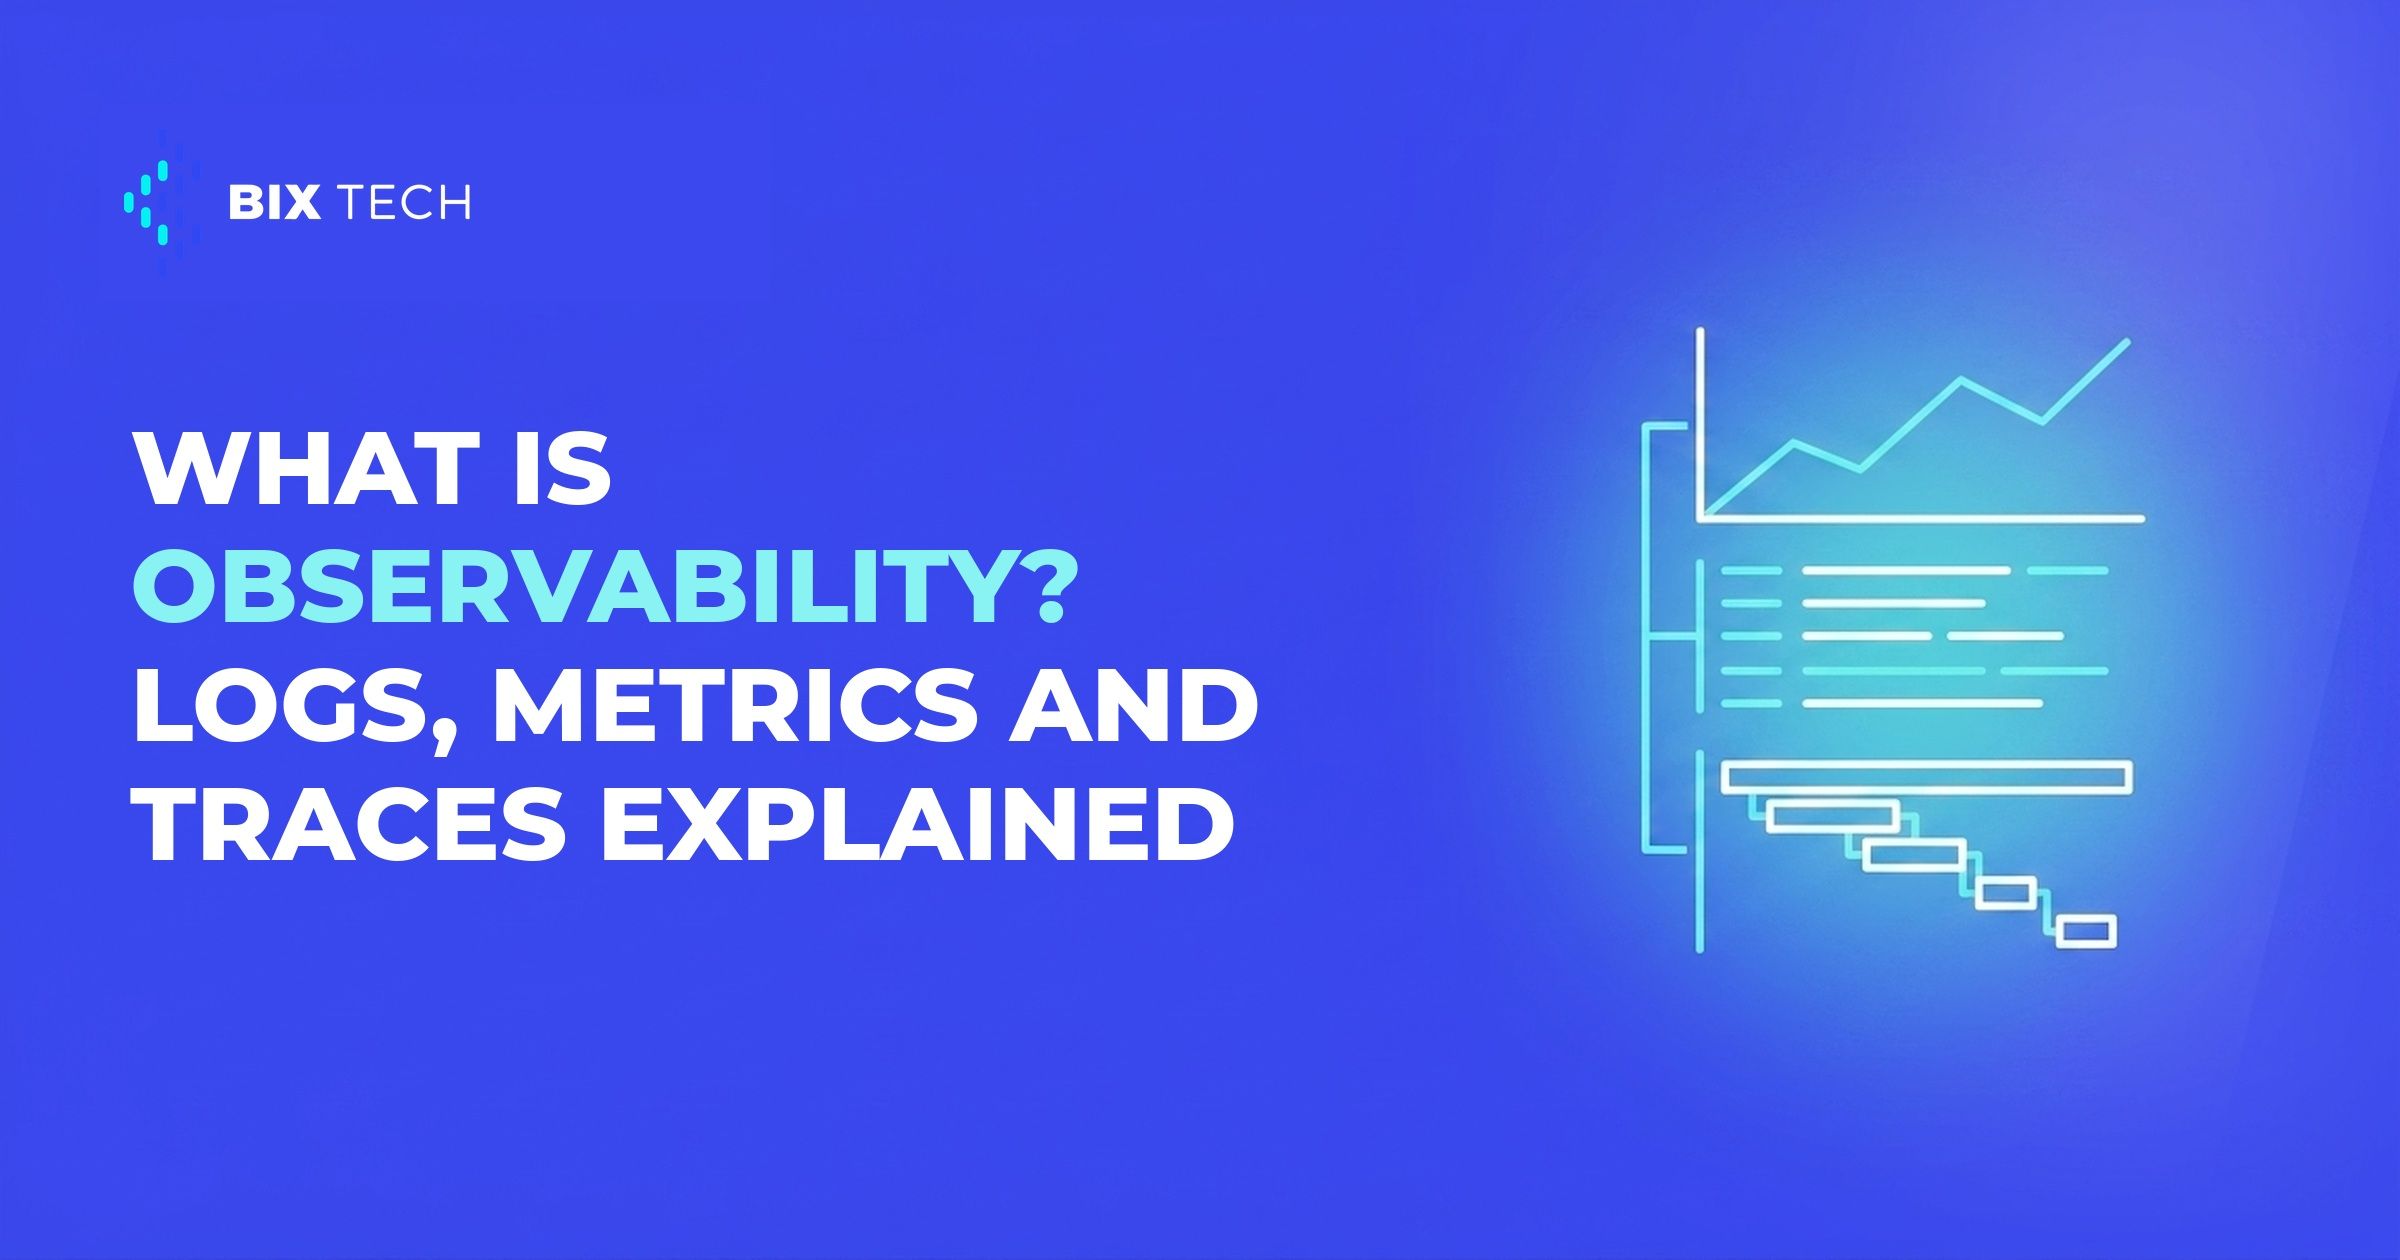
Observability is the ability to answer questions about a system's internal state using only the signals it emits. That framing matters because it separates observability from monitoring. Monitoring tells you a threshold was crossed. Observability lets you ask why, including questions you had not thought of when you instrumented the system.
The difference matters most in distributed systems, where component health and request health are not the same measurement. Each service can report normal CPU, memory and response time while a request that crosses nine of them still takes seconds, because the latency accumulates in the handoffs rather than inside any one component. Metrics scoped per service cannot expose that, since the problem only exists at the level of the full request path.
For data teams the stakes are slightly different from application teams. A web service that fails loudly gets fixed in minutes. A pipeline that fails quietly ships wrong numbers for a week, and by the time someone notices, the reports built on it have already influenced decisions. This guide covers the three signals observability is built on, how they fit together, and where each one earns its cost.
The three signals: logs, metrics and traces
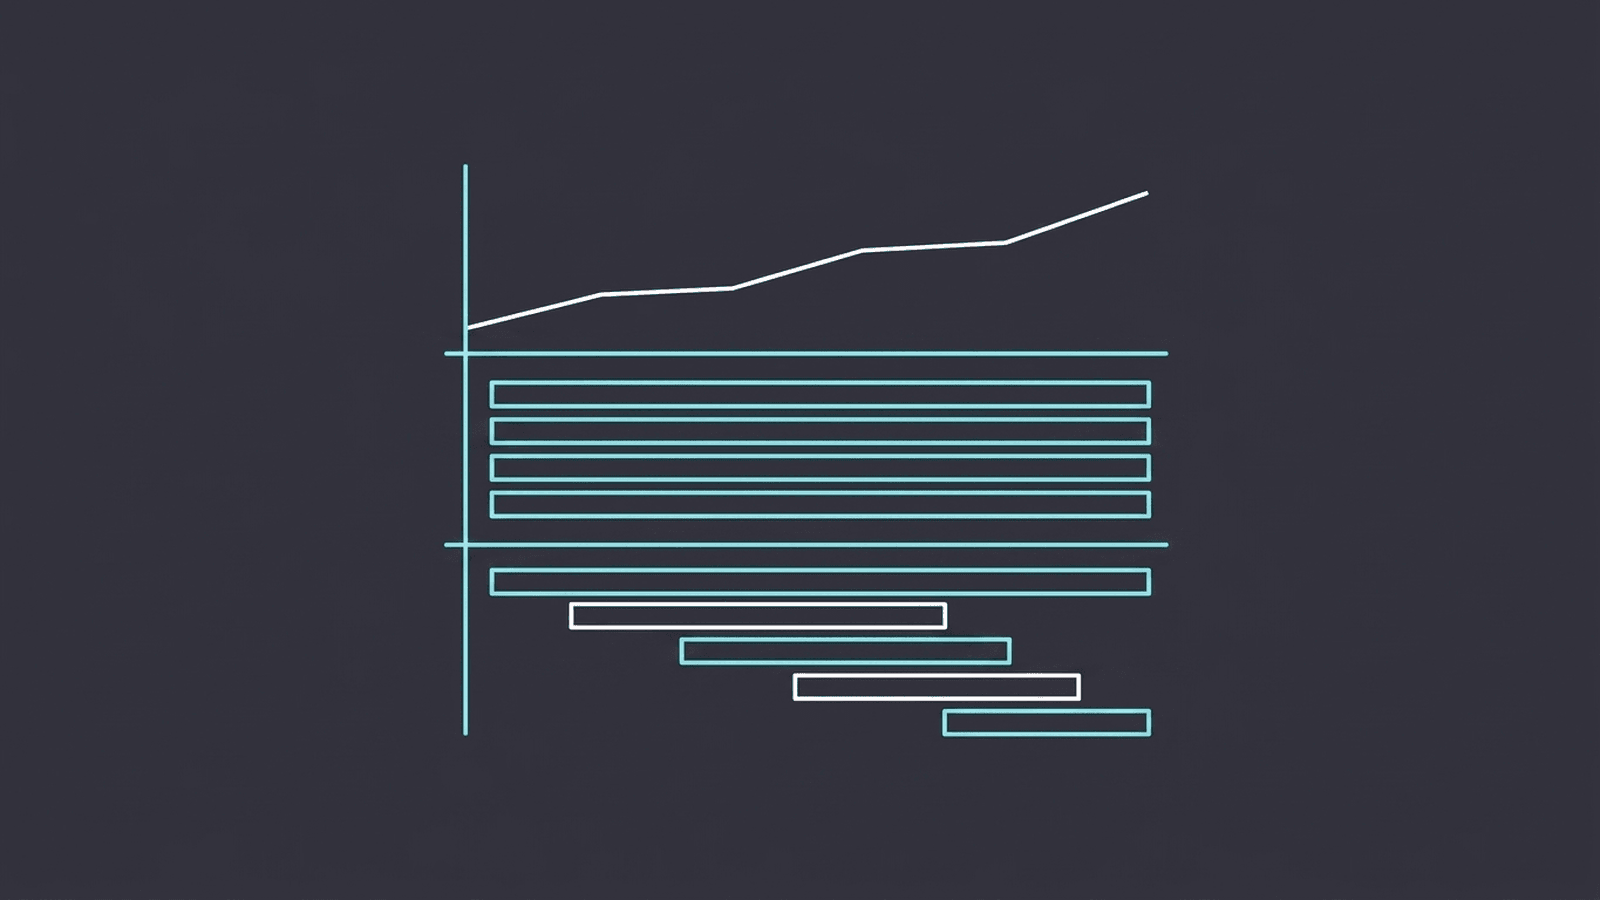
Almost every observability discussion reduces to these three, and the reason they coexist is that each answers a different class of question. Using one where another belongs is the most common and most expensive mistake.
| Signal | What it is | Best question for it | Cost profile |
|---|---|---|---|
| Metrics | Numeric measurements aggregated over time | Is this getting worse, and since when? | Cheap to store, cheap to query |
| Logs | Discrete timestamped events with context | What exactly happened in this case? | Expensive at volume, cheap per event |
| Traces | The path of one request across services | Where did the time go in this transaction? | Moderate, needs sampling at scale |
Metrics are for detection. They tell you something changed and they are cheap enough to keep at high resolution for a long window. What they cannot do is explain a single case, because aggregation destroys the individual event.
Logs are for explanation. When you know which request failed, the log line carries the context that makes the failure legible. Their weakness is cost and noise, since teams that log everything end up searching a haystack they built themselves.
Traces are for causality across boundaries. In a monolith you rarely need them. In a system where one user action touches eight services, traces are the only signal that shows the shape of the request rather than the health of the components.
Why the three only work together
A working practice moves between the signals in sequence. The metric fires, the trace localizes the failure to a service and a span, the log explains what that span was doing. Any single signal on its own leaves you guessing at one of those three steps, which is why teams that instrument all three resolve incidents in a fundamentally different way from teams that only alert on thresholds.
Instrumentation and the vendor question
The practical barrier to observability was never the concept. It was that instrumenting a system meant committing to a vendor's agent and libraries, and changing your mind later meant reinstrumenting everything.
OpenTelemetry changed that. It is a vendor-neutral standard for emitting traces, metrics and logs, now the de facto instrumentation layer across most of the industry, with its official documentation covering the language SDKs. You instrument once against the standard and choose where the data goes separately. For data pipelines specifically, this matters more than it does for web services, because pipeline stages often span orchestration tools, transformation engines and warehouses that no single vendor agent covers well.
The backend choice is then a separate and more forgiving decision. Grafana has become a common visualization layer precisely because it reads from many sources rather than owning the data. Prometheus dominates metrics collection in Kubernetes environments. Sentry occupies a narrower slot, focused on application errors and performance with the stack context developers need. BIX Tech works across these stacks, and the fit depends on whether your primary pain is infrastructure metrics, application errors, or pipeline reliability.
Alerting is where most implementations fail
Instrumentation is the easy half. The half that determines whether observability actually helps is what you do when a signal crosses a line.
Two failure modes dominate. The first is alerting on causes instead of symptoms, which produces pages for high CPU that nobody acts on because CPU is not the problem, it is a side effect. The second is alerting on everything, which trains the team to ignore alerts, at which point the system is worse than having none.
The discipline that works is narrow. Alert on symptoms a user would notice, route them to someone who can act, and make every alert either actionable or deleted. Everything else belongs on a dashboard someone consults during an investigation, not in a channel that interrupts people. Building alerts and notifications that stay signal is a design problem, not a configuration problem, and it is worth the same care as the instrumentation itself.
For pipelines the symptom set is specific and short. Freshness beyond the agreed window, volume outside the expected range, and failure of a stage that downstream consumers depend on. Those three cover most of what a data consumer would escalate, and they are far more useful than the dozens of infrastructure metrics a default setup will happily page you about.
Observability is often sold as a tooling purchase and it is really an operational habit. The organizations that get value from it are not the ones with the most complete instrumentation. They are the ones where a failing signal reliably reaches a person who can act, and where every incident leaves behind either a new alert or a deleted one. That loop is cheap to start and it is what separates a dashboard nobody opens from a system the team actually trusts.
Where to go deeper on observability
For the case that has to be made before the instrumentation work starts, why observability has become critical for data-driven products covers what goes wrong without it, and why logs, metrics, and traces save projects is the shorter version for a team that has not adopted any of the three yet. a unified view of metrics, logs, and traces goes into how the three signals correlate through a shared trace identifier, which is the mechanism that makes the difference between three separate tools and one investigation.
On the stack itself, observability with Grafana, Prometheus, and OpenTelemetry assembles the open-source path end to end, and how Sentry, Grafana, and OpenTelemetry are shaping reliable software covers how the vendor landscape settled around the OpenTelemetry standard. Sentry for errors and performance in distributed systems deals specifically with application errors, and Grafana vs Kibana compares the two front ends on the criteria that actually differ.
Data pipelines have their own failure modes, and generic application monitoring misses most of them. distributed observability for data pipelines with OpenTelemetry covers propagating context across the tasks of a DAG, logs and alerts for distributed pipelines with Sentry and Grafana covers routing a failure to the person who can fix it, and Grafana for data and infrastructure metrics covers the metrics side once the number of pipelines grows. For AI systems, where the failure is often a wrong answer rather than an error, monitoring agents and flows with Grafana and Sentry covers what to instrument.
Finally, the dashboards themselves. technical dashboards with Grafana and Prometheus covers which panels are worth building and which only add noise, and building Grafana dashboards with multiple data sources deals with the case where the signals live in different backends.
Observability tells you when something breaks; making sure the data itself meets its expectations starts with the six dimensions of data quality.
If your team is instrumenting a distributed system or a data platform and deciding how the signals should fit together, our specialists can help you design an observability layer that matches your operation. Talk to our team and move your data maturity forward. ⬇️

What is observability?
Observability is the ability to answer questions about a system's internal state using only the signals it emits, such as logs, metrics and traces. It differs from monitoring in scope: monitoring tells you a known threshold was crossed, while observability lets you investigate failures nobody anticipated when the system was instrumented.
What is the difference between logs, metrics and traces?
Metrics are aggregated numbers that show whether something is changing over time and are cheap to store. Logs are individual timestamped events that explain what happened in a specific case. Traces follow one request across multiple services to show where time was spent. Detection usually starts with metrics, localization comes from traces, and explanation comes from logs.
Is observability the same as monitoring?
No. Monitoring answers predefined questions about known failure modes, typically through thresholds and dashboards. Observability is the broader property that lets you ask new questions after the fact, without shipping new instrumentation. Monitoring is a subset of what a well instrumented system makes possible.
What is OpenTelemetry and why does it matter?
OpenTelemetry is a vendor-neutral standard for emitting traces, metrics and logs, and it is now the de facto instrumentation layer across much of the industry. It matters because it separates instrumentation from the backend that stores the data, so changing observability vendors no longer requires reinstrumenting the entire system.
How do you avoid alert fatigue?
Alert on symptoms a user would notice rather than on causes like CPU or memory, route every alert to someone who can act on it, and delete any alert that fires without producing action. For data pipelines, freshness, volume and stage failure cover most of what consumers would escalate, and a short actionable set beats broad coverage.