Analytics vs business intelligence: where each fits
Ask five people in the same company to define the difference between analytics vs business intelligence and you will get five answers. One says BI is dashboards and analytics is data science. Another says BI looks backwards and analytics looks forwards. A third says they are the same thing with different price tags. All three capture something real, and none of them helps a data leader decide what to build next quarter.
The distinction matters because the two fail for different reasons. A business intelligence problem usually turns out to be a modeling problem, where nobody agreed on how revenue is calculated. An analytics problem is usually a data problem, where the history needed to predict anything was never kept. Buying a tool for the wrong one is how budgets disappear without a single decision improving.
Gartner stopped separating them years ago, evaluating "analytics and business intelligence platforms" as a single market and framing the 2026 edition of that category as governed front ends for enterprise AI. The vendors merged and the job titles merged. What stayed genuinely different is the question you are asking and the plumbing each question requires.
What business intelligence actually covers
Business intelligence turns operational records into a trustworthy account of what happened. It spans collection from source systems, the modeling that gives those records shared meaning, the governance that controls who sees what, and the reporting surface where people read the result.
The defining characteristic is agreement. A BI number carries an implicit promise that finance, sales, and operations would all compute it the same way, and that promise is what makes a dashboard usable in a meeting. When someone says "the dashboard is wrong", they rarely mean the chart rendered incorrectly. They mean the number disagrees with the one in their own spreadsheet.
In the maturity framing most vendors and consultancies use, BI owns the first two questions. Descriptive analytics answers what happened, and diagnostic analytics answers why, by exposing trends, segments, and root causes. Both work on history that already exists, and both are judged on accuracy rather than on cleverness.
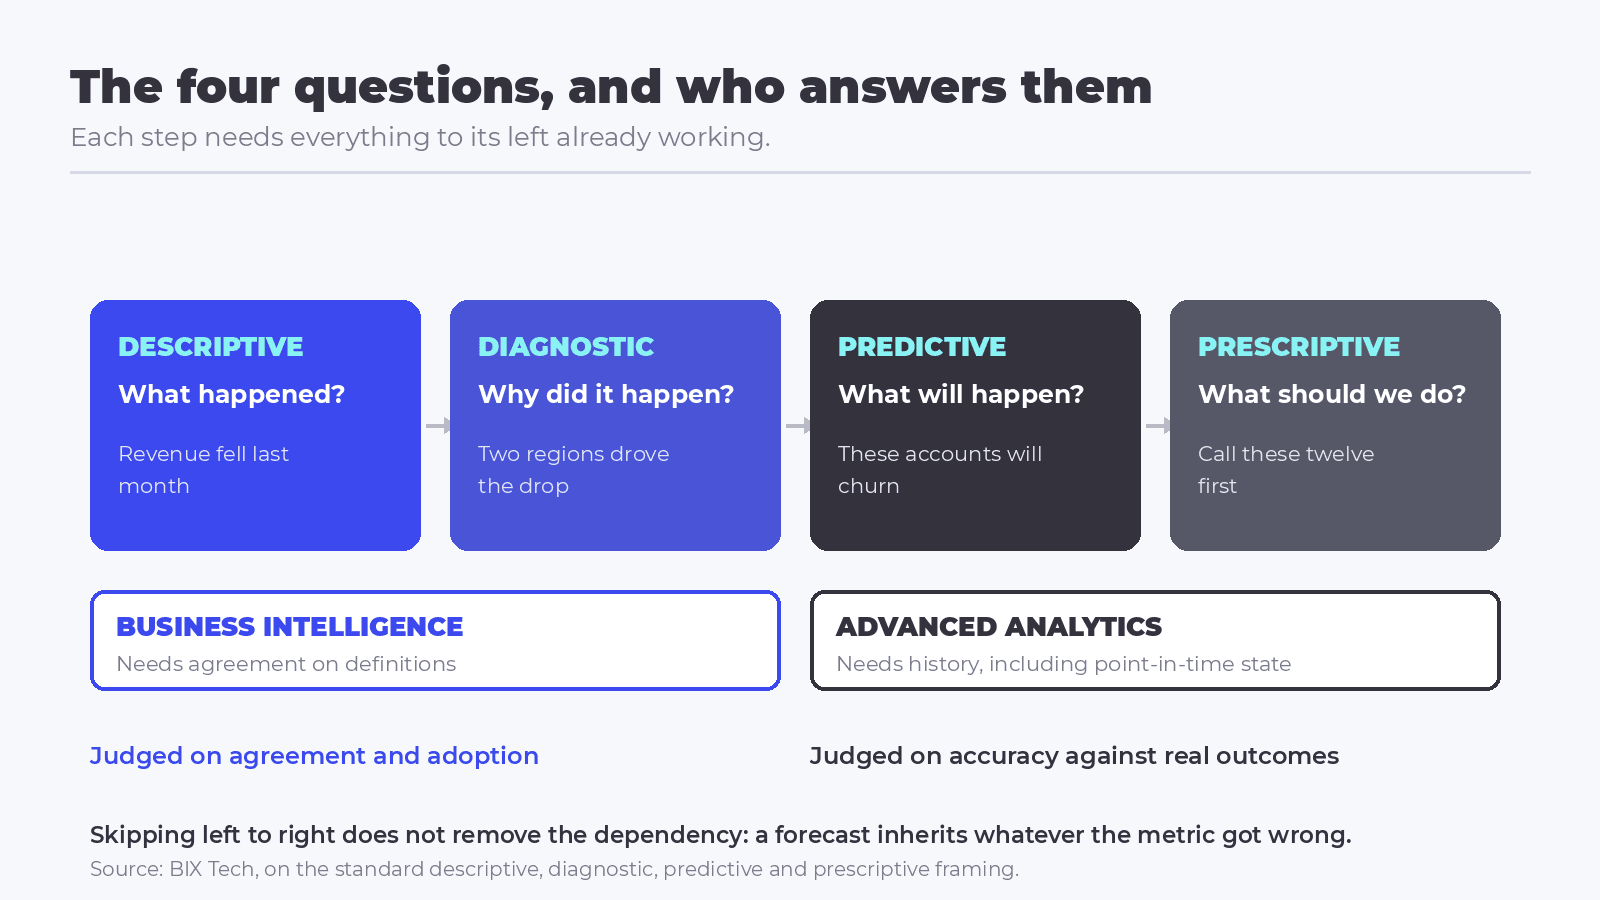 The four questions in order. Business intelligence owns the first two and needs agreement; advanced analytics owns the last two and needs history. Source: BIX Tech, based on the standard descriptive, diagnostic, predictive and prescriptive framing.
What analytics adds on top
Analytics, in the narrower sense people mean when they contrast it with BI, extracts statements that go beyond the record: exploratory analysis, statistics, forecasting, segmentation, experimentation, and machine learning. The questions move from what happened to what will happen and what to do about it.
That is predictive and prescriptive territory. Predictive analytics estimates the likelihood of a future outcome, such as which accounts will churn next quarter. Prescriptive analytics recommends an action, such as which of those accounts to call first given a fixed number of hours in the week. Our guide to what you need to know about data analysis covers the mechanics of that work in more detail.
The requirements change completely at this point. Descriptive reporting can survive on a few months of clean data. A churn model needs enough history to contain examples of churn, enough attributes to explain it, and a record of what was true at the moment of the decision. Teams discover this in the wrong order: they buy a modeling platform, then find the warehouse has been overwriting customer records for three years.
One vocabulary trap is worth naming here. Market intelligence, market research, and competitive intelligence sound adjacent and get used interchangeably in the same conversation, yet they draw on external sources and answer strategic questions rather than operational ones. Settle the differences between market intelligence, market research and competitive intelligence before a project brief mixes all four.
Analytics vs business intelligence: the differences that change a decision
Most comparisons of analytics vs business intelligence stop at "past versus future", which is true and nearly useless. The differences that change what you build concern ownership, data requirements, and what happens when the answer is wrong.
| Criterion | Business intelligence | Advanced analytics |
|---|---|---|
| Question answered | What happened, and why | What will happen, and what to do |
| Primary output | Governed metrics, reports, dashboards | Forecasts, scores, recommendations, experiments |
| Success is measured by | Agreement and adoption across teams | Accuracy against a held-out outcome |
| Data it needs | Complete and current records | Long history, including point-in-time state |
| Who typically owns it | Data platform and BI teams, with business owners | Data science and analytics engineering |
| Main failure mode | Two numbers for the same metric | A model with no usable history behind it |
| Cost driver | Licences per consumer, capacity, refresh volume | Engineering time, compute for training, data retention |
| Time to first value | Weeks | Months, and often iterative |
Read the table by column and the two look like separate departments. Read it by row and the dependency becomes obvious: every entry in the right column assumes the left column already works. A forecast built on a metric nobody agrees with inherits the disagreement and adds a confidence interval to it. Sequencing therefore beats choosing, and operations that skip BI to go straight to prediction end up doing BI anyway, under a deadline, with a model waiting on it.
Where the metric definition lives, and why it settles the argument
The most consequential decision here has nothing to do with which category you call the project. It is where the definition of a metric physically lives, and there are three options.
The definition can live in the report. Someone writes the logic for active customer inside a chart, and the next person writes it slightly differently in the next one. This is the default state of most operations and the origin of nearly every "the dashboard is wrong" complaint.
The definition can live in the BI platform's model. Microsoft's documentation describes a Power BI semantic model as "a logical description of an analytical domain, with metrics, business friendly terminology, and representation, to enable deeper analysis", typically shaped as a star schema of facts and dimensions. Every report built on it inherits the same definitions. The limitation is reach: a Python notebook or a second BI tool querying the warehouse directly bypasses it entirely.
The definition can live above the warehouse, in a layer both the BI tool and the notebook consume. This is what dbt's MetricFlow does, described in its documentation as a SQL query generation tool for metric creation across dimensions, built specifically to stop several analysts from computing the same number several ways. Metrics are defined in version-controlled YAML, which makes a metric change reviewable the way a code change is.
Open-source platforms converged on the same idea. Apache Superset presents itself as an open-source modern data exploration and visualization platform, connects to more than sixty SQL databases, and ships a semantic layer for SQL transformations alongside its no-code chart builder. Metabase added a dedicated space for models and metrics in its 2026 releases, positioning governed definitions as the input that both people and its AI assistant read from.
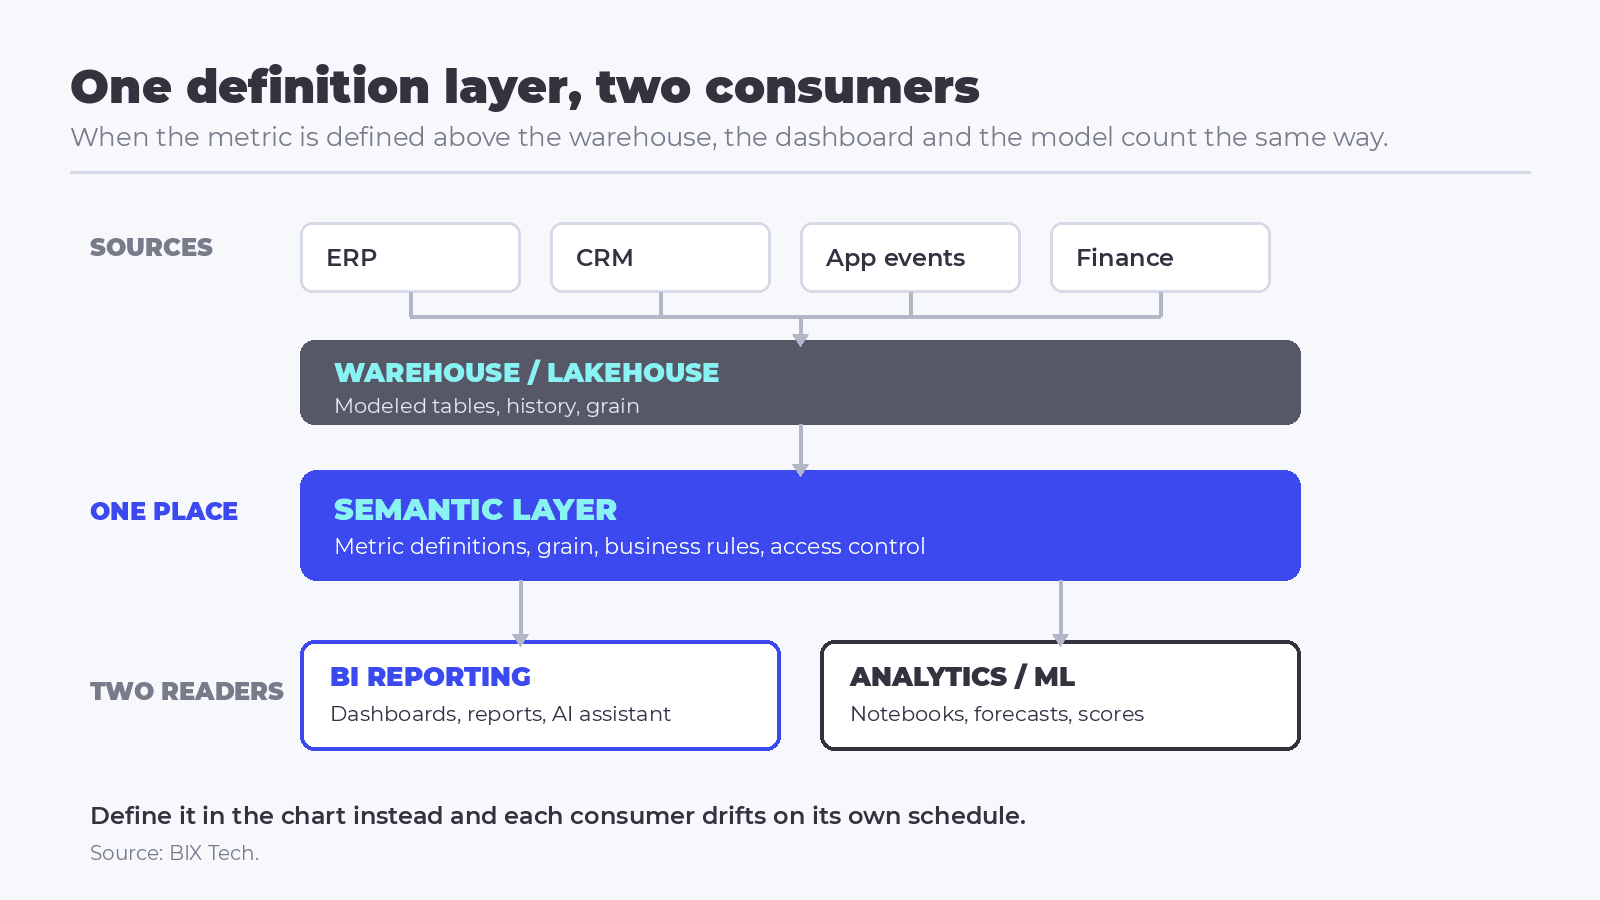 One definition layer, two consumers. When the semantic layer sits above the warehouse, the dashboard and the model read the same metric. Source: BIX Tech.
This is also where the practical link between the two disciplines sits. A shared semantic layer means the churn model and the executive dashboard count customers identically, so a disagreement between them is a real finding rather than an artefact. The dbt semantic layer in practice is worth reading before committing to one of the three options above, because migrating definitions later is expensive.
AI assistants inside the reporting surface raised the stakes of that choice. A chart with a wrong definition misleads the person looking at it. An assistant reading the same definition states the number confidently, in prose, to anyone who asks, without the visual context that might have prompted a second look. Gartner describes the category as moving toward agentic AI, governed semantics, and AI-augmented decision support, which is a precise way of saying that governed definitions became the control surface for AI on company data. Whether you call the result BI, analytics, or decision intelligence matters far less than whether those definitions are enforced.
What each one asks of your team and your budget
The staffing profiles differ more than the tooling does. BI work rewards people who can negotiate a definition across three departments and then implement it precisely. Analytics work rewards people who can frame a question as a measurable outcome and resist answers that only look good in a backtest.
Cost behaves differently too. BI cost scales with consumers, because most platforms charge per user or per unit of capacity, so a successful rollout is also a growing invoice. Analytics cost scales with engineering time and with retention, since keeping point-in-time history is a storage decision made long before anyone trains anything.
Governance is where the two meet, and where self-service either works or quietly falls apart. Opening a BI tool to hundreds of people without governed definitions produces contradictory reports faster than any central team can reconcile them. The practical middle ground, covered in our self-service BI playbook, keeps metric definitions central and lets exploration be free above them.
At BIX Tech we implement and operate across this whole span, from Power BI, Qlik and Tableau through the open-source stack and into modeling and machine learning, and the honest position is that the right combination depends on the operation. A twelve-person startup and a bank with a data office are solving different problems with the same vocabulary.
How to decide what your operation needs next
- Would three departments compute your top five metrics identically today? If not, the next project is definitional, whatever the roadmap says.
- Do people act on the reports you already have? Adding predictive output to an unread surface changes nothing.
- Do you have history that includes state at the time of the decision? Without it, predictive work is a data engineering project wearing a data science label.
- What decision do you want to change, and who makes it? A named decision and a named owner separate analytics that ships from analytics that gets demoed.
- What does the answer need to cost to be worth having? A recommendation that takes a week cannot support a decision made every morning.
Operations that answer the first three with a clear no should invest in business intelligence: sources, modeling, definitions, and a reporting surface people trust. Those that answer yes already have the foundation for predictive work, and should pick one decision to improve rather than build a platform in the abstract.
Treating analytics vs business intelligence as a choice is what causes the waste. They sit in sequence, they share one definition layer, and skipping the first only means doing it later with less time. Deciding where your metric definitions live is worth more than deciding which of the two words goes on the project charter.
Where to go deeper
To judge whether an operation has outgrown its current reporting, start with the six signs a company needs a BI solution and the problems a BI consulting engagement removes, which describe the symptoms operationally rather than in tooling terms. For the internal case, we cover how BI turns data into strategic insight and five reasons to invest in BI.
Questions about where the number comes from belong upstream of any tool choice. Begin with data sources and how they underpin BI, then what data engineering does to keep them usable. On the engine underneath, PostgreSQL and MongoDB for analytics workloads sets out when a transactional database stops being enough, and data mining inside business intelligence covers the layer between reporting and modeling.
On tool selection, the best BI tools for non-technical users is the place to start when adoption is the constraint, and cloud BI versus on-premise BI covers the deployment decision that licence pricing tends to hide. For platforms specifically, we maintain guides to Microsoft Power BI and to Metabase versus Looker for growing teams.
Governance decides whether self-service survives a few hundred users. Our guide to Power BI governance balances control against access inside one platform, and agile for data and BI teams addresses how the delivery process protects definitions or erodes them.
Once the reporting layer is trusted, the questions move past it. Dashboard design that gets used is our pillar on the display layer, and data visualization mistakes that undermine decisions catalogues the specific errors. Further out, operational BI shortens the loop to real time, while reporting to decision automation and automation intelligence describe what replaces the daily dashboard review.
Where AI meets the front end, conversational analytics versus copilot assistants separates two patterns that vendor demos conflate, and our pillar on data analytics and AI covers where the disciplines genuinely overlap.
If your operation is deciding between investing in reporting foundations and moving into predictive work, our specialists can help you map what your data actually supports and sequence the work so nothing gets built twice. Talk to the team and put a governed definition layer under both.

Frequently asked questions about analytics vs business intelligence
What is the difference between analytics and business intelligence?
Business intelligence reports what happened and why, using governed metrics built on complete records. Analytics, in the narrower sense, estimates what will happen and recommends what to do, using statistics and machine learning on historical data. BI is judged on agreement across teams; analytics is judged on accuracy against real outcomes.
Is business intelligence the same as data analytics?
Not exactly, though the market treats them as one category. Gartner evaluates vendors in a single "analytics and business intelligence platforms" market, and most tools now cover both. The practical difference is the question asked and the data required: BI needs current and complete records, while predictive analytics needs long history including point-in-time state.
Which should a company implement first, BI or advanced analytics?
Business intelligence first, in almost every case. Predictive models consume the same metric definitions that BI establishes, so a forecast built before those definitions exist inherits the disagreement. Operations whose top metrics are not yet computed identically across departments should treat the definitional work as the prerequisite, not as a parallel track.
Do you need a semantic layer for business intelligence?
You need metric definitions to live somewhere other than individual reports. That can be the BI platform's own model, such as a Power BI semantic model, or a warehouse-level layer such as dbt's semantic layer. The warehouse-level option matters when notebooks or a second BI tool also query the data, because a platform-specific model does not reach them.
How does AI change business intelligence?
AI assistants moved into the reporting surface, so the platform now answers questions in prose rather than only drawing charts. That raises the cost of a wrong metric definition, because an assistant states numbers confidently and without visual context. Gartner frames current platforms as governed front ends for enterprise AI, which makes governed definitions a prerequisite for using it.