Most companies collect more data than they use. The data is in the ERP, the CRM, the support tool and dozens of spreadsheets, and the dashboards keep growing. Yet when a manager has to make an important call, the answer often still comes from experience or from a quick spreadsheet built the night before. The problem is rarely a lack of data or tools. The problem is that nobody decided what the company should analyze first, and why.
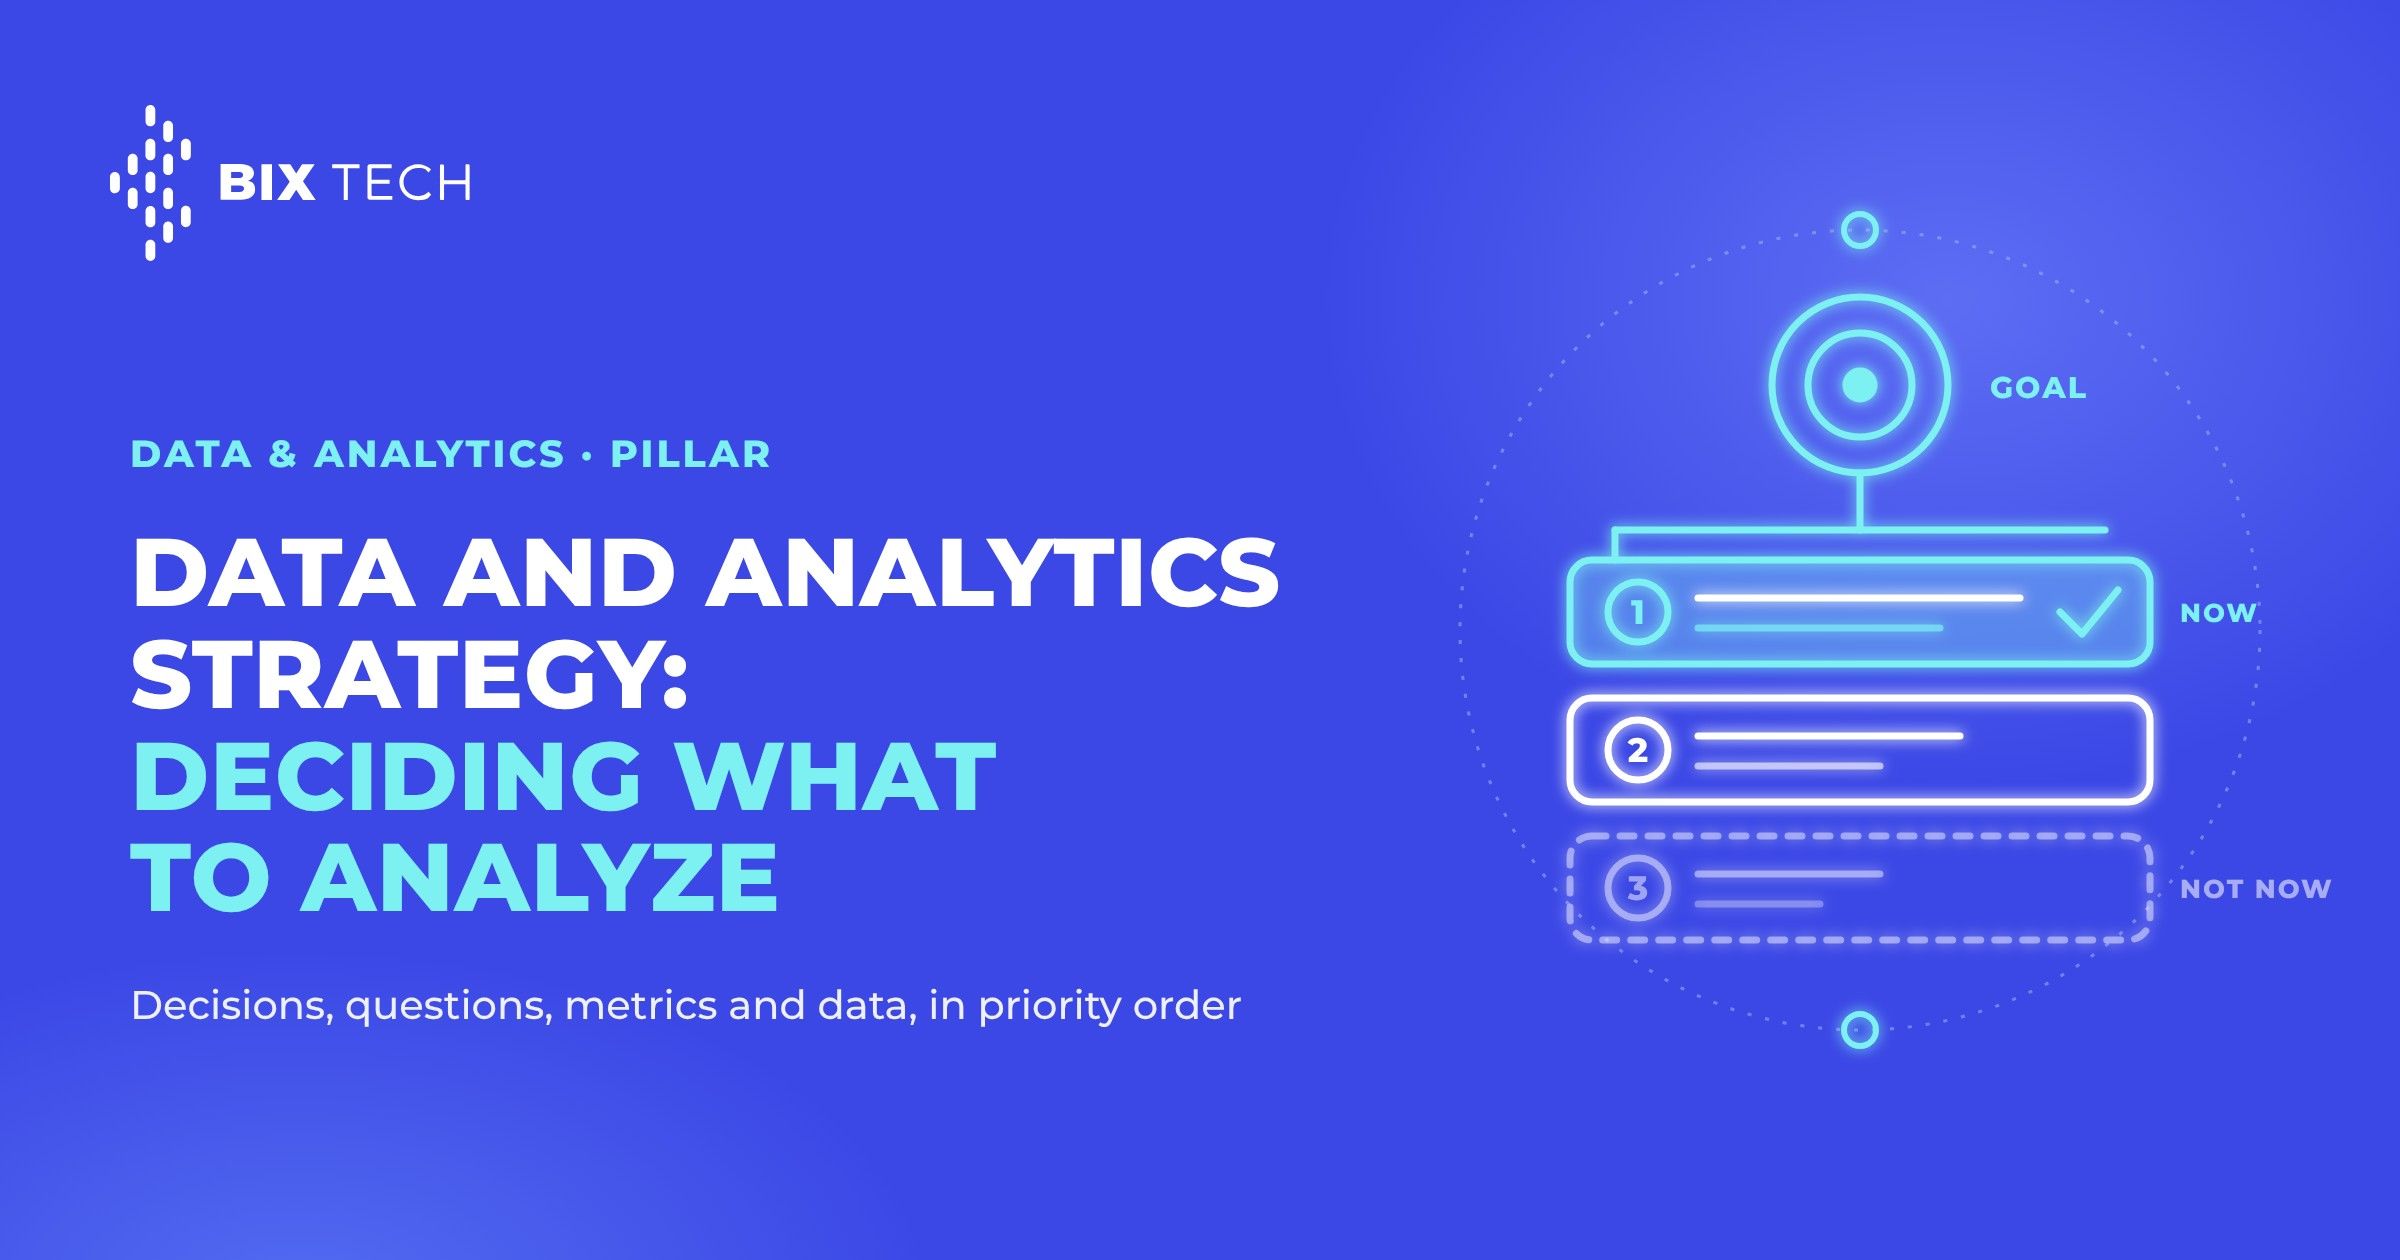
A data and analytics strategy is that decision, written down. It lists the business decisions that data should improve, the questions each decision depends on, the metrics that answer those questions, and the data and skills needed to produce them, in order of priority. It also says, just as clearly, what the company will not analyze for now.
This guide explains how to build that list. It covers what to analyze. A separate question, which approach to use for each item (business intelligence reporting or advanced analytics such as forecasting and machine learning), is covered in our guide to analytics vs business intelligence. Answer this guide's question first: you can only choose an approach once you know which question you are trying to answer.
What a data and analytics strategy is, and what it is not
A data and analytics strategy answers three questions in plain language. Which decisions matter most to the business? What information do the people making those decisions need? What does the company have to build, buy or fix to deliver that information? The output is usually a document of a few pages and a ranked list of use cases, each with an owner.
People often split the topic in two. A data strategy covers how data is collected, stored, protected and governed. An analytics strategy covers how that data is used to answer questions and support decisions. The two depend on each other, so this guide treats them together, but it starts from use: the reason to collect and govern data is to answer questions that matter.
It also helps to be clear about what a strategy is not. A list of tools is not a strategy, because a tool does not say which question to answer. An architecture diagram is not a strategy, because it describes how data moves, not why. A backlog of dashboard requests is not a strategy either, because it reflects who asked last, not what matters most. All three are useful later, once the priorities exist.
Start from decisions, not from data
The most common way to start is also the least effective: take the data you have and look for something interesting in it. This data first approach produces reports that are correct but unused, because nobody asked for them and nobody changes what they do after reading them.
The reliable way is to work in the opposite direction. Start with a business goal, find the decisions that move it, write the question behind each decision, choose the metric that answers it, and only then list the data required. Each step narrows the work and keeps it connected to a result.
- Business goalReduce customer churn by 15% this year.
- DecisionWhich accounts should the success team call this week?
- QuestionWhich active accounts show signs that they may cancel?
- MetricA weekly churn risk score per account, plus the monthly churn rate.
- DataProduct usage, support tickets, contract renewal dates and billing history.
One use case, written from the goal down to the data. The data list at the end is short and specific because every earlier step limited it.
This example shows why the order matters. If the team had started from the data, it might have built a general usage dashboard with fifty charts. Because it started from the decision, it knows it needs one score per account, every week, delivered to the people who make the calls. That is a much smaller and more useful project.
When the company has more than one goal, a metric tree keeps the goals and the use cases connected. The tree puts the main result at the top, for example net revenue retention, and below it the driver metrics that teams can change, such as renewal rate, upsell conversion or support resolution time. Every use case should move at least one driver in the tree. If a use case moves none of them, it is probably not a priority.
How to find the decisions worth analyzing
The best source of decisions is a set of short interviews with the people who make them: the heads of sales, operations, finance, marketing and customer success, plus a few people who run daily processes. Thirty to forty five minutes per person is enough. The goal is not to collect report requests, but to understand which decisions they make and how.
- Which decisions do you make every week or every month? Recurring decisions benefit most from analysis, because an improvement repeats every cycle.
- What do you use today to make them? If the answer is experience, a manual spreadsheet or a report nobody trusts, there is room to improve.
- What does a wrong decision cost? Lost revenue, extra stock, overtime, a missed deadline. This gives a first estimate of value.
- What would you do differently if you had the answer? If the person cannot name an action, the question is interesting but not useful yet.
- How fast do you need the answer? A decision made every morning needs data that arrives before the morning. A quarterly decision does not.
After the interviews, group similar answers. You will usually find that five to ten decisions come up again and again across areas, such as pricing, stock levels, which leads to prioritize, which customers may leave, or where costs grow faster than revenue. Those recurring decisions are the candidates for your strategy.
Turn each decision into a use case
A decision becomes something the data team can work on once it is written as a use case with the same fields every time. Using a fixed format makes use cases easy to compare and stops vague requests from entering the list. Each use case should state:
- Decision and owner: the decision to improve and the person who makes it.
- Question: the specific question the analysis must answer, in one sentence.
- Metric: how the answer is expressed, with an agreed definition.
- Data: the sources needed and whether they exist today.
- Action: what the owner will do differently based on the answer.
- Delivery: where and when the owner receives the answer, such as an alert in the CRM, a list in the support tool or a weekly report.
- Success measure: the business result that shows the use case worked, such as lower churn or less stock.
The action field is the most important one. A use case without a clear action produces information without impact: people read it, agree it is interesting, and keep doing what they did before. If no action can be written, the use case goes to the "not now" list. The delivery field matters for the same reason: an answer that stays in a dashboard the owner never opens does not change the decision, so put it in the tool the owner already uses at the moment the decision is made.
Prioritize by value, readiness and effort
With ten or twenty use cases written down, the team needs a simple and transparent way to rank them. A score from 1 to 5 on four criteria is enough for most companies. Keep the method simple, so that business leaders can understand it and agree with the result.
How much money, time or risk the better decision is worth per year. Use the cost of a wrong decision from the interviews.
Whether the data exists, can be accessed, has enough history and has an agreed definition.
The work needed to deliver a first usable answer: integration, modeling, analysis and training. A lower effort gets a higher score.
Whether a named person has the authority and the time to change the decision based on the answer.
Start with the use cases that score high on value and on data readiness. They deliver results quickly and build trust in the program, which makes it easier to fund the harder items later. Use cases with high value but low readiness are not discarded: they show where to invest in data foundations, such as integrating a new source or keeping history that is overwritten today.
How to turn the ranked list into a timeline, with quarters, dependencies and team capacity, is covered step by step in our guide to building a data roadmap aligned with business strategy.
Check the data before you commit
The data readiness score deserves a closer look, because it is where most plans fail. Before a use case enters the first wave, the data team should confirm four things: the data exists, it can be accessed with reasonable effort, it has enough history for the question, and the business agrees on the definition of the main metric.
History is the point teams most often miss. A question about trends or predictions needs data from the past, recorded as it was at the time. Many operational systems overwrite records when something changes, so the history is lost. If a future use case depends on history, the strategy should start storing it now, even before the analysis begins. Our readiness guide for advanced analytics lists the signals to check.
Access is the second common problem. Data for one question is often spread across several systems. Moving all of it into a warehouse before testing the question can take months. For a first test, it is often enough to query the data where it already lives, with a federated query engine, and decide later whether the use case justifies a permanent pipeline. How that works, and when it is the right choice, is explained in our guide to data federation.
Freshness is the third check. Ask how quickly the decision needs the answer, and build for that speed, not more. A daily update covers most business decisions. Real time data costs more to build and to run, and it only pays off when someone acts within minutes. Our guide to when real-time analytics adds value helps make that call.
Decide what not to analyze
A strategy is as much about what you leave out as about what you include. Every analysis takes time to build and to maintain, and every report that nobody uses still costs refresh time, licenses and support. A short, written "not now" list protects the team from requests that would split its time across too many small tasks.
- Questions with no action. If nobody will act differently on the answer, the analysis can wait.
- Metrics that only look good. Totals that always go up, such as cumulative sign ups, rarely support a decision. Prefer rates and comparisons.
- Rare, low value decisions. A decision made once a year with little money at stake can be supported by a one time analysis, not a permanent dashboard.
- Questions the data cannot answer yet. Record them, together with the data they need, and revisit them when that data exists.
The list should be reviewed every quarter. Items move up when the business changes or the data becomes available. Being explicit about it also makes conversations with stakeholders easier: a request is not ignored, it is recorded and ranked like any other.
Who owns the strategy
A data and analytics strategy needs owners on the business side, not only in the data team. Each use case has a business owner who makes the decision and judges whether the analysis helped. The data team owns the data, the models and the delivery. An executive sponsor settles conflicts between areas and protects the priority list when new requests arrive.
Shared definitions also need an owner. When sales and finance calculate revenue differently, every analysis built on top inherits the disagreement. Naming one person per business area who approves metric definitions solves most of it. Our guide to data governance without bureaucracy shows how to keep that light. Once definitions are agreed, more people can explore data on their own, as described in our guide to self-service analytics.
Measure whether the strategy works
The success of a data and analytics strategy is measured by better decisions, not by the number of dashboards delivered. For each use case, compare the success measure before and after: churn rate, stock levels, forecast error, hours saved. If the measure did not move, find out whether the analysis was wrong, late, or simply not used.
- Use cases with a business result: the share of delivered use cases whose success measure improved.
- Usage by decision owners: whether the people who own the decision actually open and use the output.
- Time to first answer: how long it takes from approving a use case to delivering the first usable result.
- Share of decisions on agreed metrics: how many key decisions rely on metrics with an approved definition.
These indicators also show the company's overall data maturity. Our data maturity model describes the typical levels and what changes between them.
Common data and analytics strategy mistakes
If your company has plenty of data but no clear priorities, our specialists can help you map the decisions that matter, rank the use cases and check what your data supports today, as part of our assessment and data analytics work. Talk to our team and start with the questions that move your business.

Data and analytics strategy FAQ
What is a data and analytics strategy?
A data and analytics strategy is a written plan that lists the business decisions data should improve, the questions and metrics behind each decision, and the data and skills needed to deliver them, in order of priority. It also records what the company will not analyze for now. Its purpose is to focus data work on results the business cares about.
What is the difference between a data strategy and an analytics strategy?
A data strategy covers how data is collected, stored, protected and governed. An analytics strategy covers how that data is used to answer questions and support decisions. Most companies benefit from treating them together, starting from the decisions, because the reason to manage data well is to use it.
How do you decide what to analyze first?
List the recurring decisions that matter most, write each one as a use case with an owner, a question, a metric and an action, and score it from 1 to 5 on business value, data readiness, effort and the presence of an owner who will act. Start with the use cases that combine high value and high readiness.
How is this different from choosing between BI and advanced analytics?
This strategy decides what to analyze: which decisions and questions deserve attention. Choosing between business intelligence and advanced analytics decides how to answer each question, for example with governed reports or with a forecasting model. The first choice comes before the second. Our guide to analytics vs business intelligence covers that second step.
How often should a data and analytics strategy be reviewed?
Review the ranked list of use cases every quarter and the overall strategy once a year. Quarterly reviews move items in and out of the "not now" list as goals, data and people change. The yearly review checks whether the business goals behind the strategy are still the right ones.