Distributed tracing, LLM metrics and log correlation to debug multi-agent pipelines without guesswork.
Adding observability for AI agents has stopped being a refinement for advanced teams and become a prerequisite for taking an agentic system to production. When a single user request fires a chain of decisions, the agent picks an action, calls a tool, queries a model and hands off to another agent, the exact point of failure gets lost along the way. Without seeing that flow end to end, debugging an error turns into expensive guesswork.
OpenTelemetry (OTel, the open, vendor-neutral standard maintained by the CNCF for collecting traces, metrics and logs from any application) is today the most consolidated foundation for that visibility. According to Gartner, more than 40% of agentic AI projects are expected to be canceled by the end of 2027, largely on rising cost and weak trust in what the system does under the hood. Observability is what turns a black-box agent into something measurable, the same principle behind moving LLMs into real business workflows.
This guide shows how to instrument a multi-agent system with the three signals of OpenTelemetry: distributed tracing across agent calls, metrics for LLM latency and cost, and log correlation to reach the root cause of a failure. All of it with the stance of a team that works across multiple data and AI architectures, treating no single tool as the one answer.
Why AI agents break traditional observability
Traditional application monitoring (APM) was designed for deterministic requests: a request comes in, follows a predictable path, and a response goes out. An AI agent breaks that premise. The control flow is decided at runtime by the model itself, so two runs of the same question can take different paths, call different tools and spend different amounts of tokens. That non-determinism is what makes autonomous agents powerful and, at the same time, hard to debug.
Three differences the old model does not cover stand out. Latency rarely lives in your code; it sits in the LLM call, which answers in seconds, not milliseconds. Cost is variable and proportional to input and output tokens, something no classic APM measures. And failure tends to cascade: one agent passes bad context to the next, and the error only surfaces three steps later, far from its origin. Tracking that takes the same data quality discipline applied to the system's behavior.
| Dimension | Traditional application | AI agent system |
|---|---|---|
| Control flow | Fixed and predictable | Decided by the model at runtime |
| Dominant latency | Database, network | LLM call (seconds) |
| Cost per request | Practically fixed | Variable, proportional to tokens |
| Origin of failure | Local, in the stack trace | Cascading across agents and tools |
| Repeatability | Same input, same path | Same input, different paths |
The three signals that give observability for AI agents
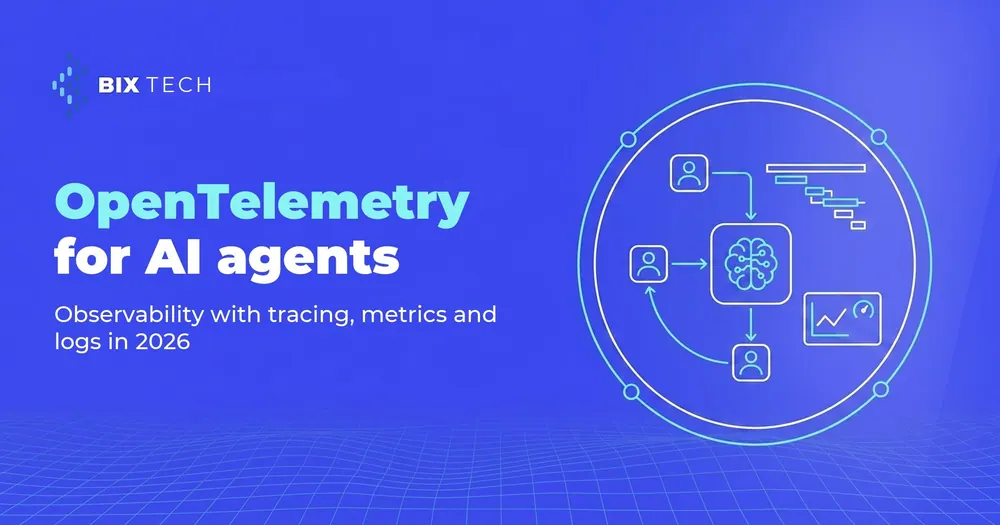
Distributed tracing is the heart of observability for an agentic system. Each user request becomes a trace, and each step inside it becomes a span: the agent's decision, the model call, the tool query, another agent's response. Spans nest and carry the same trace identifier, so you see the whole execution tree and where the time went. That is what lets you debug communication between agents without opening every log by hand.
Metrics answer the question of scale: how many calls, how slow, how expensive. In an agent system, the ones that matter most are latency per step (including time to first token), the count of input and output tokens, cost per answer, and error rate per tool or model. Tracking those numbers over time is what avoids the surprise on the bill and supports any decision about data operations at scale.
Logs come in to explain the why. A structured log, written with the same trace identifier as the span that produced it, lets you jump straight from the slow point in the execution tree to the message describing what happened there: the prompt sent, the model's raw response, the argument the tool received. That correlation between log and trace is what turns loose text into diagnosis, the same logic behind the continuous monitoring used in data pipelines.
To standardize all of this, OpenTelemetry maintains a set of semantic conventions for generative AI, still evolving, that defines attribute names such as the AI system used, the requested model and the token count. Adopting these conventions from the start stops each team from inventing its own schema and makes it easier to switch visualization backends later, without reinstrumenting the code, a care similar to keeping BI that drives decisions rather than just illustrating them.
| Signal | Question it answers | Example in an agent |
|---|---|---|
| Traces | Where did it go and where did it stall? | Span tree: agent → LLM → tool → agent |
| Metrics | How much, how fast, how expensive? | Latency per step, tokens, cost, error rate |
| Logs | What exactly happened there? | Prompt, model response, tool argument |
How to instrument a multi-agent pipeline in practice
The starting point is the OpenTelemetry SDK in the application's language, with auto-instrumentation on. It already captures HTTP calls, database queries and API requests without you writing code, which covers much of the infrastructure around the agent. From there, the work is to instrument what is specific to the agentic domain, something that fits well into already structured multi-agent systems.
Next, create manual spans around each unit of decision. Open a span when the agent starts reasoning, another for each tool call and another for each model request, attaching the GenAI convention attributes (model, tokens, cost). The detail that makes the difference in a multi-agent system is context propagation: when handing work from one agent to the next, the trace identifier has to travel along, or the tree breaks into disconnected pieces. Keeping that thread connected takes the same governed transformation of data care any pipeline demands.
Finally, export the data via OTLP (OpenTelemetry's native protocol) to a Collector, which centralizes, processes and forwards the signals to the backend of your choice. Because OTel is vendor-neutral, the same instrumented code feeds different observability tools without a rewrite, and you switch vendors without touching the application, a portability principle that also holds for anyone who already built a data warehouse and wants the next step. Ecosystem tools such as OpenLLMetry and OpenInference already package much of that LLM-specific instrumentation on top of OTel, saving manual work.
| Step | What to do | Result |
|---|---|---|
| 1. SDK + auto-instrumentation | Turn on the OTel SDK and auto-instrumentation | HTTP, database and APIs traced without code |
| 2. Manual spans | Wrap the agent's decision, the tool and the LLM call | Each agentic step becomes a span with attributes |
| 3. Context propagation | Pass the trace identifier between agents | A single, connected execution tree |
| 4. Export via OTLP | Send to the Collector and chosen backend | Visualization and alerts, without lock-in |
Tracing multi-agent pipelines is easier when each agent exists for a reason, and the reasoning behind that choice is in our guide to how AI agents work.
Agent tracing applies the same principles as any distributed system, and those principles are laid out in what observability is and how it works.
Adding observability to AI agent systems in 2026 is less about picking a tool and more about instrumenting behavior rigorously: one trace per request, latency and cost metrics per step, and correlated logs to find the root cause. Teams that treat this as engineering, not as a pretty dashboard built after the incident, are the ones that can trust agents running in production. If your company is taking AI agents to production and wants to see every decision, cost and failure in the pipeline, our specialists can help structure the right observability for your context. Talk to our team and move your data maturity forward. ⬇️
FAQ: Frequently asked questions
What is observability for AI agents? It is the ability to see, measure and explain the behavior of an agentic system in production. In practice, it means tracing every decision, model call and tool use with traces, measuring latency, tokens and cost with metrics, and correlating logs by trace identifier to reach the root cause of a failure, without relying on guesswork.
What is OpenTelemetry and why use it with AI agents? OpenTelemetry is an open, vendor-neutral standard, maintained by the CNCF, for collecting traces, metrics and logs. With AI agents, it standardizes instrumentation and avoids lock-in: the same code feeds different observability backends, so you switch visualization tools without rewriting the application.
What are the three signals of OpenTelemetry? They are traces, metrics and logs. Traces show where the request went and where it stalled, with nested spans revealing each agent step. Metrics measure volume, latency and cost. Logs explain what happened at each point. Together, the three give the full picture of an agentic pipeline.
How do you trace a failure in a multi-agent pipeline? Ensure context propagation: the trace identifier has to travel between agents so every step falls under the same trace. With a connected execution tree, you pinpoint the span where the time or error appeared and jump to the correlated log, which carries the prompt and response from that exact point.
Does OpenTelemetry help monitor LLM cost? Yes. By instrumenting each model call with input and output token metrics and the GenAI semantic-convention attributes, cost per answer becomes a number you can track over time. That lets you set spending alerts and spot which agent or step is inflating the bill before it surprises you.