Postgres analytics limits are the most common blind spot in a growing data stack. The database that started as the product's transactional store quietly becomes the reporting backend, then the BI source, then the thing the whole company queries at nine on a Monday. Then a dashboard that used to load in two seconds takes ninety, and nobody can point to the change that caused it, which is usually the first sign of an architecture question rather than a tuning question.
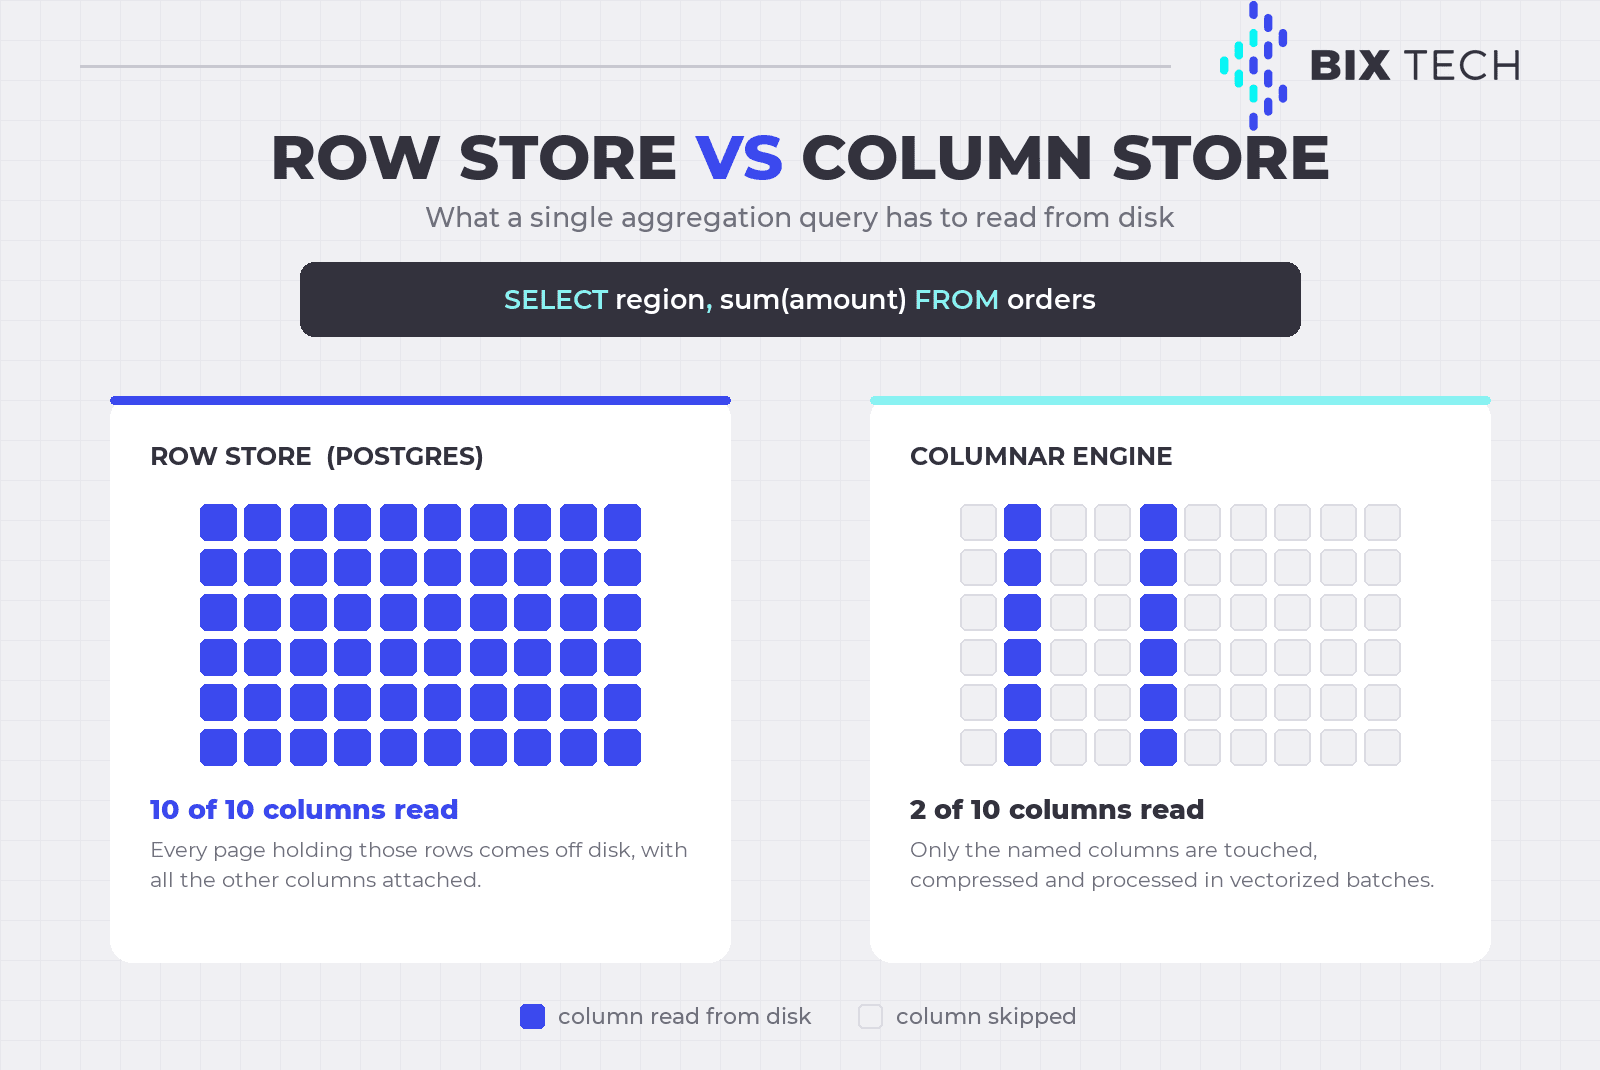
The reason sits in the storage layout. Postgres is a row store: it writes an entire tuple contiguously on an 8 KB page, which is perfect when a query fetches one order by its id and wasteful when a query sums one column across two hundred million rows. The engine reads every page holding those rows, carries the other columns along, and evicts the transactional working set from shared buffers while doing it. Adding an index rarely helps, since the planner already knows a full scan is cheaper, a behavior that shows up whenever teams compare engines for BI and exploration workloads.
So the useful question is where the line sits. Postgres absorbs far more analytical work than most teams expect, and the ecosystem around it in 2026 pushes that line further still. This guide maps the real ceiling: what Postgres does well, which signals say you hit the wall, what benchmarks show against columnar engines, and how to choose between tuning it, extending it, or moving to a dedicated warehouse.
What Postgres actually does well for analytics
Start with the hard numbers, because they are almost never the binding constraint. According to the official PostgreSQL documentation, a single table tops out at 32 TB with the default 8 KB block size, holds up to 1,600 columns, and database size is unlimited. Few workloads ever touch those ceilings, so a team blaming "Postgres capacity" for a slow report is usually describing something else, much like the confusion around data volume versus data quality.
What Postgres does well is everything that reduces how much data a query touches. Declarative partitioning prunes whole partitions when the filter matches the partition key, so a query over last month reads last month. BRIN indexes cost almost nothing to maintain and shine on naturally ordered columns like an append-only timestamp. Materialized views turn a repeated dashboard aggregation into a precomputed table, the same principle behind aggregation strategies in BI tools.
Query execution has improved too. Parallel query splits scans, joins, and aggregates across worker processes, and PostgreSQL 18 added an asynchronous I/O subsystem with io_uring support on Linux, letting the server issue several I/O requests at once instead of waiting for each. The PostgreSQL project reports throughput gains of up to three times in some scenarios, which widens the window where staying put is the sensible call for a lean data engineering setup.
One engine also means one backup strategy, one permission model, and no pipeline keeping an analytical copy fresh. A second platform adds latency between the transaction and the report, plus a class of reconciliation bugs that surface at month end. Teams running a modern stack across several tools know that cost is real.
Where the Postgres analytics limits actually show up
The wall is rarely a single metric. MotherDuck, in its guide on outgrowing Postgres for analytics, places the transition zone between 10 GB and 1 TB and argues the diagnosis only becomes reliable when three or four warning signs appear together. One bad number is a tuning problem, while a cluster of them points to a structural mismatch, the logic behind monitoring data quality at the source.
The table below lists the signals worth instrumenting before the argument reaches the budget meeting. Treat the thresholds as orientation, since they shift with hardware, query shape, and how much of the dataset is hot, a nuance that matters when defining what to observe in a system.
| Signal | Orientation threshold | What it usually means |
|---|---|---|
| Buffer cache hit ratio on analytical queries | Below 90% | The working set no longer fits in memory |
| Replica lag during reporting windows | Above 5 minutes | Analytics is competing with replication |
| Sustained I/O wait during reports | 10% to 20% and climbing | Storage throughput saturated by scans |
| Bloat on the largest tables | 20% to 30% | Long queries are blocking vacuum |
| Recurring sequential scans on indexed tables | Persistent, despite indexes | The planner gave up on the index path |
Two catalog views give you most of those numbers with no extra tooling. The queries below rank tables by how much they miss the cache and how much dead weight they carry, usually enough to tell a tuning problem apart from a structural one before anyone opens an architecture discussion.
-- 1. Cache hit ratio per table: the working set that no longer fits in memory
SELECT relname,
       heap_blks_read,
       round(100.0 * heap_blks_hit
             / nullif(heap_blks_hit + heap_blks_read, 0), 1) AS cache_hit_pct
FROM pg_statio_user_tables
ORDER BY heap_blks_read DESC
LIMIT 10;
-- 2. Scan mix and bloat: sequential scans winning, vacuum falling behind
SELECT relname,
seq_scan,
idx_scan,
round(100.0 * n_dead_tup
/ nullif(n_live_tup + n_dead_tup, 0), 1) AS bloat_pct
FROM pg_stat_user_tables
ORDER BY n_dead_tup DESC
LIMIT 10;
Concurrency deserves its own line, because it breaks earlier than volume does. Postgres allocates a backend process per connection, and each analytical query claims work_mem for every sort and hash node in its plan. Twenty analysts aggregating at once can multiply memory demand past what the instance has, the failure mode behind most "the BI tool killed production" incidents and a strong argument for isolating dashboards from the transactional path.
Two more constraints appear as workloads mature. MVCC keeps old row versions until vacuum reclaims them, so frequently updated tables carry dead tuples that inflate every scan, while long analytical queries delay the cleanup. Wide fact tables amplify the penalty, since a query reading four columns out of a hundred still pays for all hundred, exactly the cost that columnar engines were designed to remove.
What benchmarks say about Postgres and columnar engines
Public benchmarks give the gap a shape. ClickBench, the analytical benchmark maintained by ClickHouse, runs 43 queries over a flat table of roughly 100 million rows and publishes results for more than 60 database systems. Row stores land far behind columnar engines there, and the reason is mechanical: columnar systems read only the columns a query names, compress them heavily, and process them in vectorized batches, as our look at ClickHouse performance tuning explains in more depth.
The benchmark's own documentation is blunt about scope, and it matters here. ClickBench uses one denormalized table, which disadvantages normalized warehouses, and runs queries sequentially, so it says nothing about concurrency. The maintainers state plainly that every benchmark is biased toward the workload it was built around. Any number taken from it describes a scan-heavy pattern your reporting layer may not resemble, a caveat worth carrying into any warehouse comparison.
The more interesting development is that the columnar engine can now run inside Postgres. Extensions such as pg_duckdb embed DuckDB's vectorized execution into the server and query Parquet, Iceberg, and Delta Lake files in object storage, while pg_mooncake mirrors columnstore tables into Iceberg for near real-time analytics. ClickHouse reported that at the end of January 2026 its pg_clickhouse extension became the fastest Postgres analytics extension on ClickBench, tracking close to native ClickHouse, which changes the calculus for teams that would rather not run a second platform.
The extension route trades one kind of complexity for another. Managed services support different extension catalogs, upgrade paths get tighter, and an extension thriving today may be archived tomorrow, as happened with ParadeDB's pg_analytics in early 2025. At BIX Tech we work across multiple data platforms, so the recommendation stays situational: it depends on team size, SLA, and the operational surface the company can carry alongside its governance model.
How to decide: tune, extend, or move to a warehouse
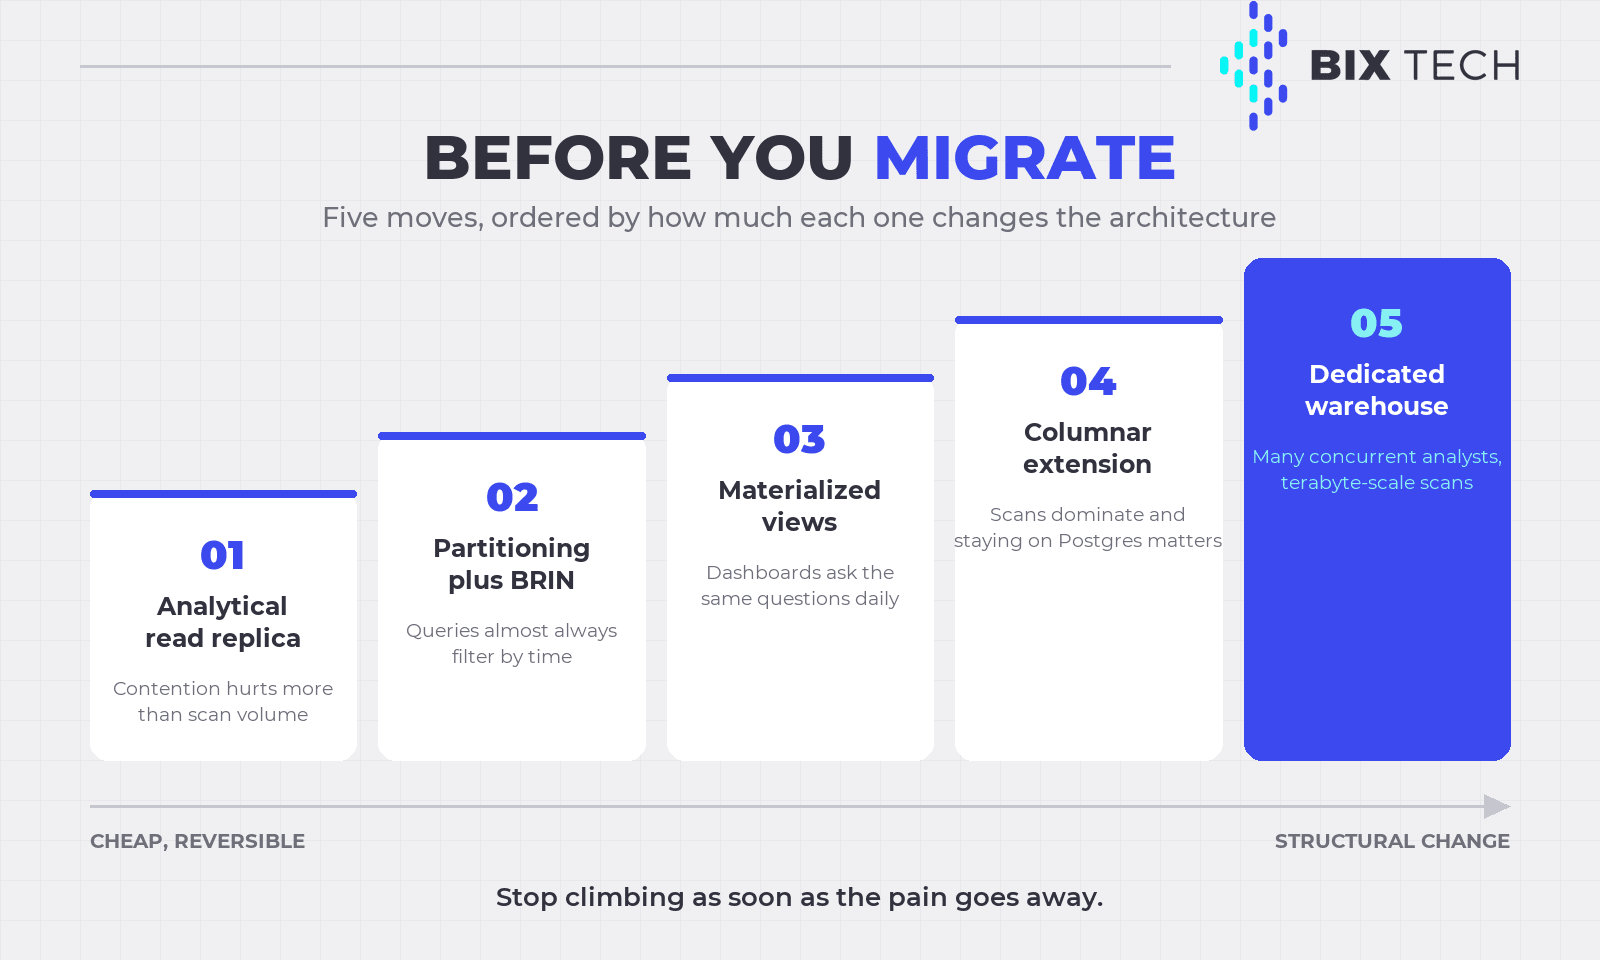
Decisions get easier when the options sit side by side. The table below maps five realistic paths, ordered by how much each changes the architecture, so a team can start at the top and stop when the pain goes away instead of jumping to a migration that a well-designed transformation layer might have made unnecessary.
| Path | What it changes | Fits best when |
|---|---|---|
| Analytical read replica | Isolates reporting from the write path | Contention hurts more than scan volume |
| Partitioning plus BRIN | Prunes what each query has to read | Queries almost always filter by time |
| Materialized views and rollups | Precomputes repeated aggregations | Dashboards ask the same questions daily |
| Columnar extension in Postgres | Adds vectorized columnar execution | Scans dominate and staying on Postgres matters |
| Dedicated warehouse or OLAP engine | Separates the analytical engine entirely | Many concurrent analysts, terabyte-scale scans |
The first three cost almost nothing to try and solve a large share of real cases. A replica, time partitioning, and a handful of well-chosen materialized views routinely take a struggling reporting layer back to acceptable latency and buy a year of runway. Spend it on modeling, since clean medallion-style layering removes more query time than most hardware upgrades.
The last rung earns its keep on a different axis: concurrency and elasticity. When forty people query at once, when the finance close needs compute that sits idle the rest of the month, or when analytical data arrives from systems that were never in the transactional database, a separate engine stops being overhead and becomes the cheaper option. Teams that get there usually find the modeling and the ownership harder than the migration itself, a lesson covered in our guide on what comes after the warehouse is built.
Cost behaves differently on each side, and that surprises people. Postgres cost is mostly fixed, tied to an instance provisioned for the peak, so an idle Sunday costs the same as a busy Monday. Warehouse cost is mostly variable, tied to scanned bytes or compute seconds, which rewards partitioning and punishes SELECT * habits. Neither model is inherently cheaper, and the comparison only gets honest once you price the real query pattern, the discipline behind cost optimization on any cloud warehouse.
Postgres for analytics goes further than its reputation suggests, and not as far as its advocates claim. Instrument the five signals, exhaust the cheap paths in order, and let the metrics decide when the row store stops fitting the job. If your team is watching reports slow down and wants a clear read on whether to stretch Postgres or design the next layer, our specialists can help benchmark the workload and choose the architecture that fits your context. Talk to our team and move your data maturity forward. ⬇️

FAQ: frequently asked questions
What are the Postgres analytics limits in practice? The practical Postgres analytics limits are rarely the documented ceilings of 32 TB per table or 1,600 columns. They show up as symptoms: buffer cache hit ratio below 90% on analytical queries, replica lag above five minutes during reporting, sustained I/O wait, table bloat over 20%, and recurring sequential scans. Three or four of those together signal a structural mismatch.
How much data can Postgres handle for analytics? There is no fixed number, but the transition zone commonly discussed in the industry sits between 10 GB and 1 TB of analytical data, depending on query shape and concurrency. Narrow queries over partitioned, time-ordered tables scale much further than wide aggregations over unpartitioned fact tables, so measure the workload rather than the total size.
When should you move from Postgres to a data warehouse? Move when concurrency and elasticity become the constraint. Dozens of analysts querying simultaneously, month-end compute that sits idle the rest of the time, or analytical data arriving from systems outside the transactional database all favor a separate engine. Before that, an analytical replica, partitioning, and materialized views usually recover enough performance.
Can Postgres extensions replace a data warehouse? Extensions such as pg_duckdb, pg_mooncake, and pg_clickhouse bring columnar storage and vectorized execution into Postgres and close a large part of the analytical gap. They fit teams that want to avoid a second platform. They also add operational surface, depend on what your managed provider allows, and carry project maturity risk, so the choice stays situational.
Why are analytical queries slow in Postgres even with indexes? Because Postgres stores data by row. A query that aggregates a few columns across millions of rows still reads every page holding those rows, including all the columns it does not need, so the planner correctly chooses a sequential scan over an index. Columnar engines avoid that by reading only the requested columns, compressed and processed in vectorized batches.