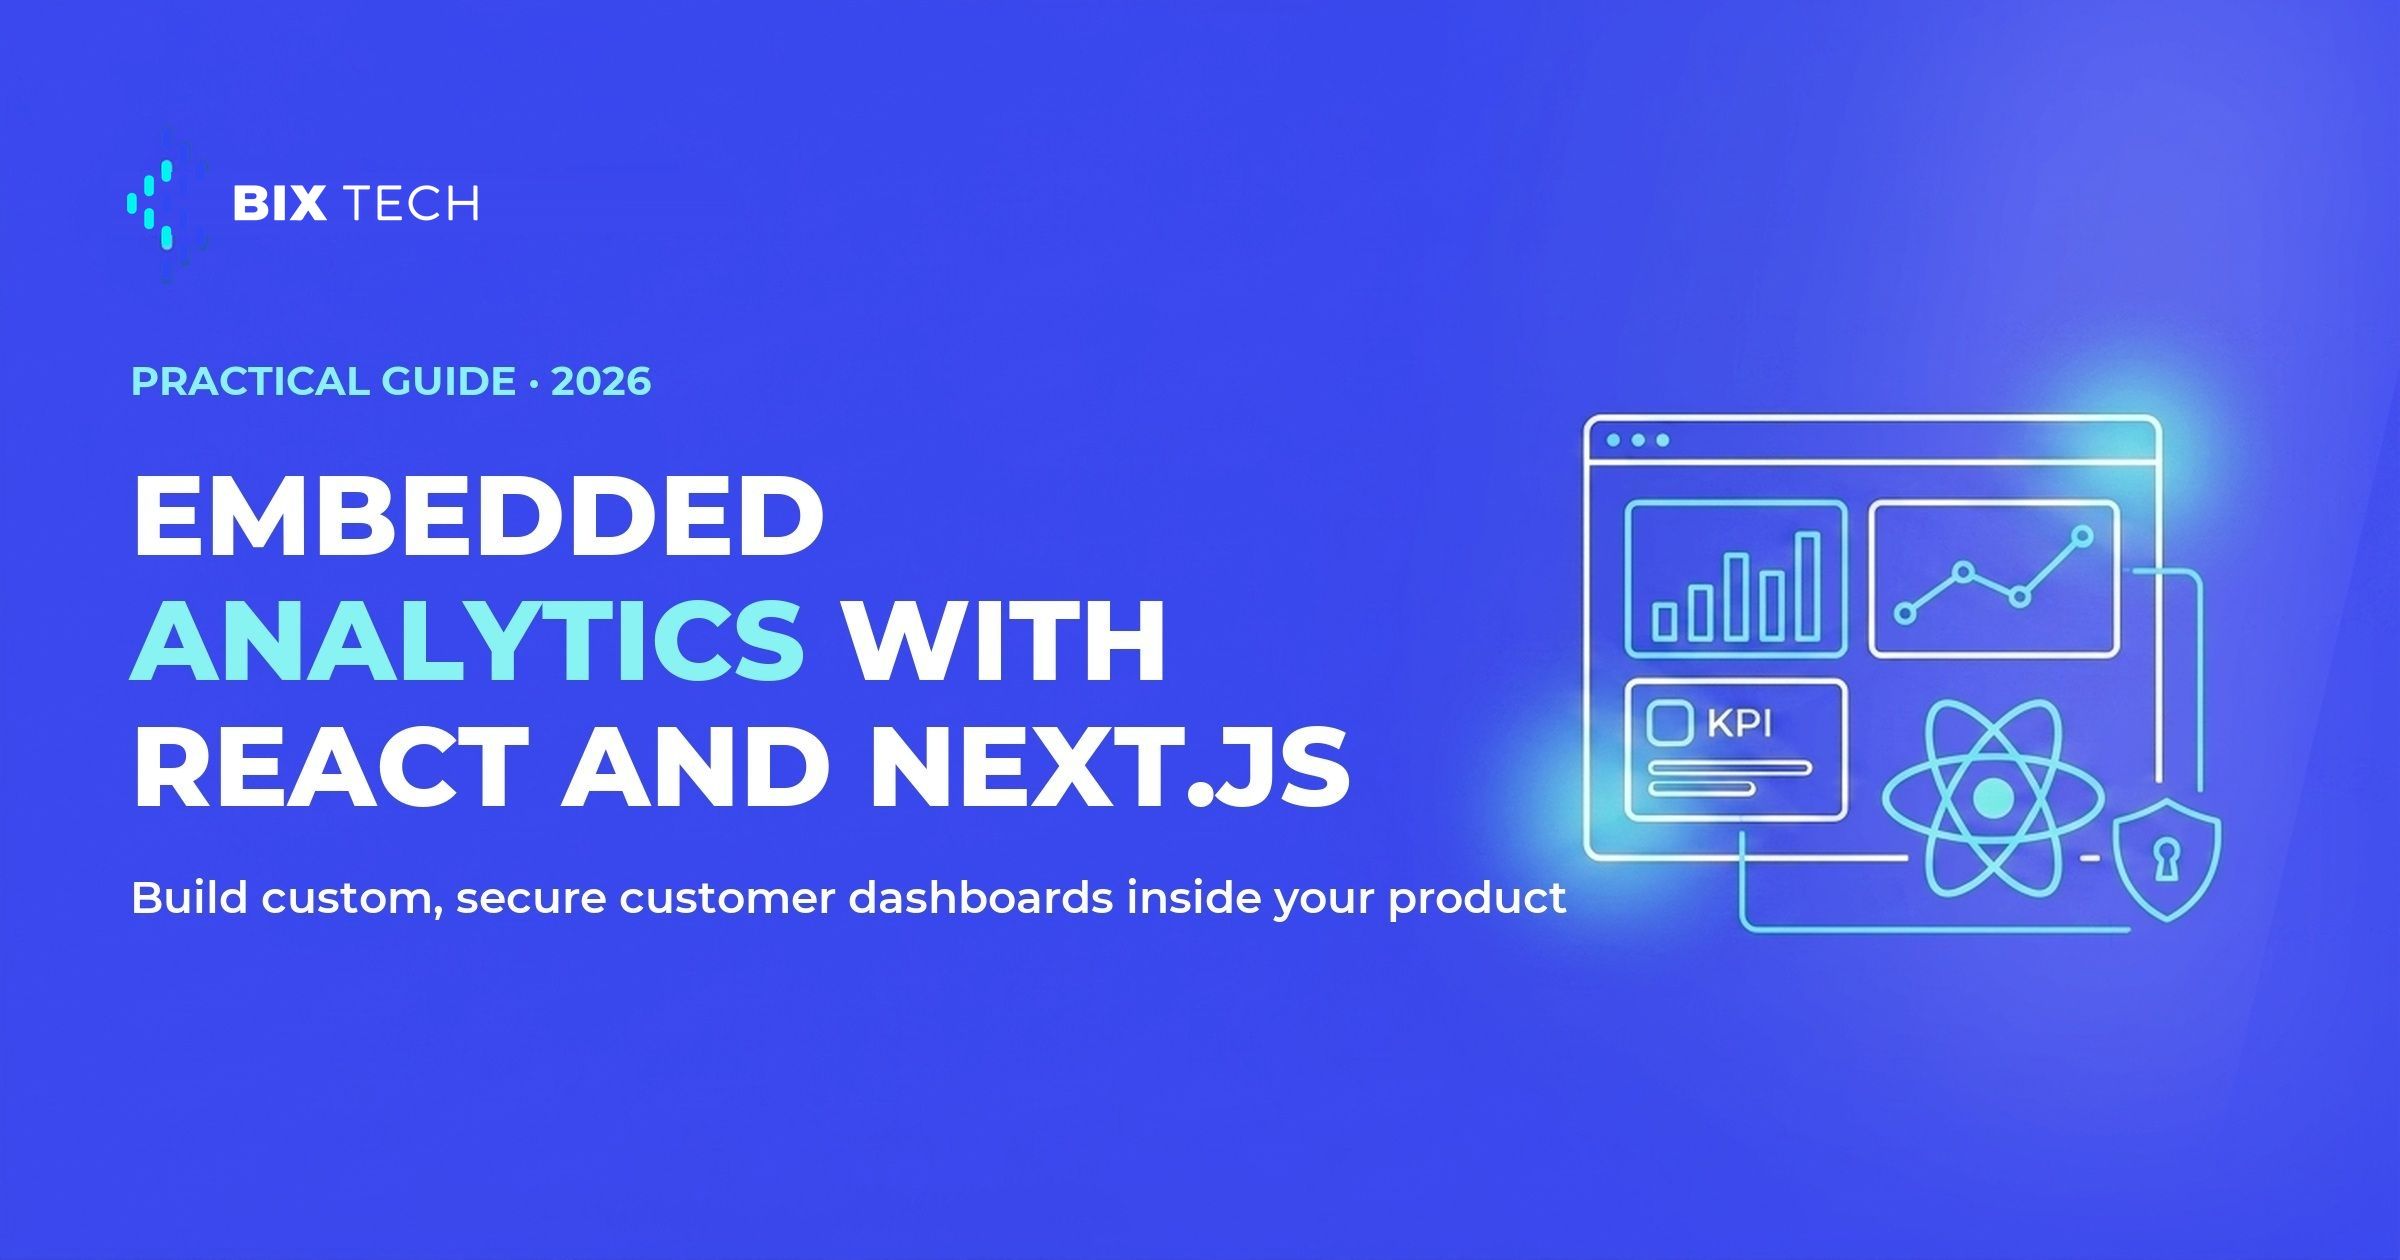
Your customers no longer accept exporting a CSV and opening it in a separate tool to understand their own data. They expect charts, filters and drill-downs living inside the product they already pay for, styled like the rest of the interface. That expectation is what makes embedded analytics with React and Next.js one of the most requested features in B2B software today, and also one of the easiest to get wrong. The gap between a dashboard people trust and one they ignore usually comes down to how the customer-facing dashboard was designed to drive decisions, not how pretty it looks.
Embedded analytics means the analytics experience lives inside your application, scoped to the exact data a given user is allowed to see. Done well, it turns raw tables into insight without ever sending the user to a third-party portal. Done poorly, it leaks one customer's rows to another or ships a slow, generic iframe nobody relies on. That difference is mostly a question of architecture and security, which is the same reasoning behind any decision to build custom software instead of bolting on an off-the-shelf tool.
This guide walks through how teams build embedded analytics with React and Next.js in practice: the rendering model that keeps dashboards fast, the data layer that keeps numbers consistent, and the security design that keeps one tenant from ever seeing another's data. The chart library matters far less than the governed metrics layer feeding it.
The architecture below assumes the pages being embedded already follow the dashboard design rules of this cluster.
What is embedded analytics, and why React and Next.js?
Embedded analytics is the practice of putting reporting, visualization and self-service exploration directly into a software product, rather than in a standalone business intelligence tool. The user stays in your app, sees your branding, and works with data already filtered to their account. It is the delivery mechanism that connects your data platform to the person making a decision, and it complements rather than replaces the heavier BI tools your internal teams already compare.
React fits this job because its component model maps cleanly onto dashboards: a chart, a filter and a KPI card are all reusable components with their own state. According to the Stack Overflow Developer Survey, React remains among the most widely used web technologies, which means a large talent pool and a mature ecosystem of charting libraries. The official React documentation describes this component and state model in depth, and it is the same foundation any modern frontend engineering effort already relies on.
Next.js adds the server layer that embedded analytics needs. With React Server Components and server-side data fetching, the query to your warehouse runs on the server, close to your credentials and security rules, and only the finished result reaches the browser. The Next.js documentation details how server components, streaming and caching work together, and that server boundary is exactly where a well-structured data platform earns its keep.
Embedded analytics inside SaaS products
For a SaaS product, embedded analytics is rarely just a feature. It is a retention and monetization lever. When customers can answer their own questions inside the app, they log in more often, open fewer support tickets, and see the product as the system of record for their operation. That stickiness is why many teams weigh embedded analytics the same way they weigh the decision to build custom software instead of relying on an off-the-shelf tool: it shapes how the whole product is perceived, not just one screen.
There is a commercial angle too. Analytics inside SaaS often becomes a paid tier, an upsell, or the differentiator that wins a deal against a competitor that still exports spreadsheets. That only holds if the numbers are trustworthy across every account, which is where a governed metrics layer feeding the dashboards stops each tenant from seeing a slightly different version of the truth. The SaaS context also raises the stakes on isolation: multi-tenancy is the norm, not the exception, so scoping every query to the right account is a baseline requirement rather than a nice-to-have, and it feeds directly into the architecture and security choices that follow.
The architecture behind fast embedded analytics dashboards
A responsive dashboard starts well before the frontend. Under the components sits a data layer: a warehouse such as BigQuery or Snowflake, a semantic layer that defines each metric once, and an API that serves scoped results. Defining metrics in a shared semantic layer is what keeps "active users" meaning the same thing in the product, the invoice and the board deck. Skipping it is how two dashboards end up disagreeing over the same number.
Performance then becomes a rendering decision. Next.js lets you fetch and aggregate data in server components, cache the expensive queries, and stream the page so the shell appears while heavy charts load. Interactive pieces like tooltips, brushes and cross-filters stay in client components, hydrated only where interactivity is real. This split keeps the initial load light even when the query behind it is heavy, and it pairs naturally with cost controls on the warehouse side so a popular dashboard does not quietly multiply your bill.
Charting is the last mile. Libraries such as Recharts, visx and ECharts render well inside React, so the real design choice is how much control you want over interaction and theming. Whatever you pick, treat the dashboard as software with tests and versioning, the same discipline that keeps data pipelines reliable in production.
How to secure multi-tenant customer dashboards
Security is where embedded analytics stops being a frontend task. When several customers share one application, the cardinal rule is that data scoping happens on the server, inside the query, from an identity the client cannot forge. A tenant id pulled from the authenticated session decides which rows come back, and no filter sent from the browser is ever trusted on its own. This is the same end-to-end mindset used to protect a data stack, applied at the query boundary.
Credentials deserve the same care. The browser should never hold a warehouse connection string or a long-lived key. Next.js server components and route handlers keep secrets on the server, while the client receives only short-lived, signed responses. Row-level security in the warehouse adds a second layer, so even a bug in the API cannot return rows outside a tenant's scope. Combining application-level checks with database-level rules is what turns a demo into a system you can put in front of paying users, and it is a natural extension of how governed platforms audit and control access.
The table below sums up the practices that separate a safe multi-tenant dashboard from a risky one, keeping in mind that a data and software consultancy works with several stacks and the right mix always depends on the operation.
| Concern | Risky pattern | Safer practice |
|---|---|---|
| Tenant isolation | Filtering rows in client code | Scoping every query by session tenant id on the server |
| Credentials | Warehouse keys in the browser bundle | Secrets held server-side, short-lived signed responses |
| Authorization | Trusting filters sent from the client | Row-level security in the warehouse plus API checks |
| Data exposure | One query returning all tenants | Least-privilege connections per request |
Build in-house or embed a BI tool?
Not every team should hand-build every chart. Sometimes embedding an existing BI product is the faster path, and sometimes a fully custom React and Next.js build is worth the investment. The decision is situational, and it usually turns on how much control over branding, interaction and data flow the product actually needs. For teams already invested in Microsoft, Power BI Embedded is documented for exactly this scenario, and its trade-offs echo the wider question of Power BI and Microsoft Fabric licensing.
A custom build gives you pixel-level control, a native feel and full ownership of the security model, at the cost of engineering time. Embedding a BI tool ships faster and offloads maintenance, at the cost of theming limits and per-user licensing that grows with your customer base. Most mature products end up blending both, using a migration path that fits their existing stack rather than committing to a single approach on day one.
More than the framework or the vendor, what separates embedded analytics that customers trust from analytics they quietly abandon is treating data correctness and tenant security as architecture from the first commit. React and Next.js give you the rendering and server tools; the semantic layer gives you consistent numbers; row-level security gives you isolation. Wire those three together deliberately, and the dashboard becomes a feature customers renew for instead of a support ticket waiting to happen.
If your company is building embedded analytics with React and Next.js into its product, our specialists can help you structure the architecture, data layer and security model that best fit your context. Talk to our team and move your data maturity forward. ⬇️

What is embedded analytics with React and Next.js? Embedded analytics with React and Next.js is the practice of building reporting and data visualization directly inside a web product using React components and Next.js server rendering, instead of a separate BI tool. The user stays in the app, sees native branding, and works only with data scoped to their account, with queries running securely on the server.
Why use React and Next.js for customer-facing dashboards? React fits dashboards because charts, filters and KPI cards are natural reusable components with their own state, backed by a large ecosystem of charting libraries. Next.js adds server components, streaming and caching, so heavy queries run on the server near your credentials and only the finished result reaches the browser, keeping dashboards fast and secrets protected.
How do you secure a multi-tenant embedded dashboard? Scope every query on the server using a tenant id from the authenticated session, and never trust a filter sent from the client. Keep warehouse credentials off the browser with server components and route handlers, and add row-level security in the database so even an API bug cannot return another tenant's rows. Combine application and database layers.
Should you build embedded analytics in-house or embed a BI tool? It depends on context. A custom React and Next.js build gives pixel-level control, native feel and full ownership of the security model, at the cost of engineering time. Embedding a tool like Power BI Embedded ships faster but limits theming and adds per-user licensing. Many products blend both as they scale.
What is the difference between embedded analytics and a standalone BI tool? Embedded analytics lives inside your product, matches your branding and shows each user only their own data, without leaving the app. A standalone BI tool is a separate platform, usually aimed at internal analysts, where users log in elsewhere to explore data. Embedded analytics prioritizes the customer experience and tenant isolation inside the software itself.