Last updated: July 27, 2026
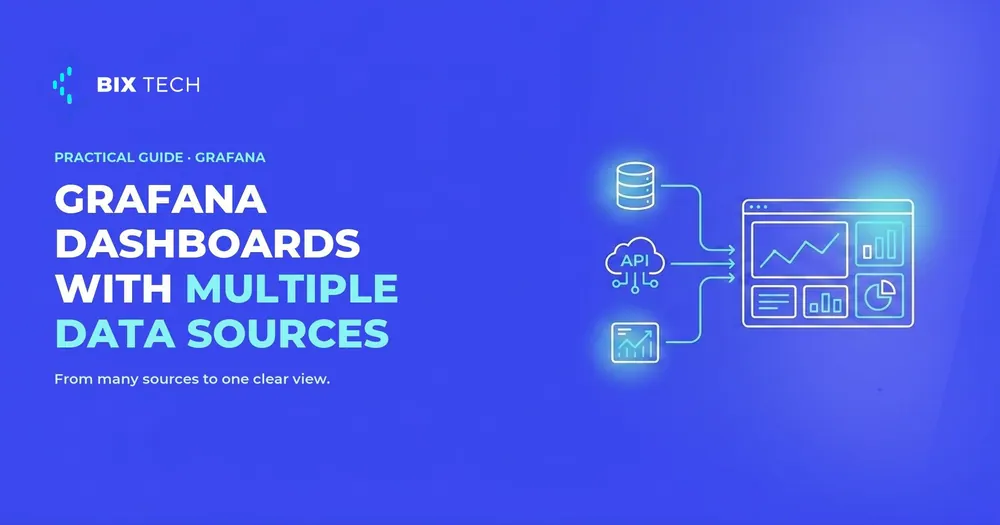
Building Grafana dashboards with multiple data sources is how most teams go from scattered signals to one place where they can actually decide something. Infrastructure metrics live in Prometheus, application events sit in Elasticsearch, business numbers are in PostgreSQL or BigQuery, and half the context is trapped in some REST API. A dashboard that pulls all of that together is what turns raw telemetry into a decision.
The problem is that combining sources is where dashboards usually break. Queries return different shapes, keys do not match, timestamps disagree, and one heavy join quietly makes every panel slow. So the real skill is not adding another data source, it is joining them cleanly and keeping the whole board fast. That is the same discipline behind any good custom analytics dashboard.
This guide is a practical reference for that work. It covers Grafana's data pipeline, how to run several queries in one panel, how to merge and join across sources, the performance rules that keep multi-source boards responsive, and the troubleshooting patterns that save hours. Whether you run Grafana next to your modern data stack or alongside an observability layer, the mechanics are the same.
Quick answer: how do you unify multiple data sources in a single Grafana dashboard? Set the panel data source to Mixed, add one query per source, give each a clear alias, then use transformations to align them. Join by field on a shared key when schemas differ, or Merge when they match. Filter and aggregate at the source first to keep the panel fast.
On this page
- How Grafana turns raw data into visuals
- How to combine multiple data sources in one dashboard
- Transformations reference: merge, join, and reshape
- Mixing data sources and formats in one panel
- Performance and scalability best practices
- Modeling keys and schemas for clean joins
- Building panels teams can trust
- Real-world patterns you can reuse
- Troubleshooting common pitfalls
- A quick build checklist
- FAQ
How Grafana turns raw data into visuals {#pipeline}
Before you combine anything, it helps to see Grafana as a pipeline. Each panel runs the same stages, and every multi-source problem maps back to one of them. Understanding that flow is what makes dashboard design predictable instead of trial and error.
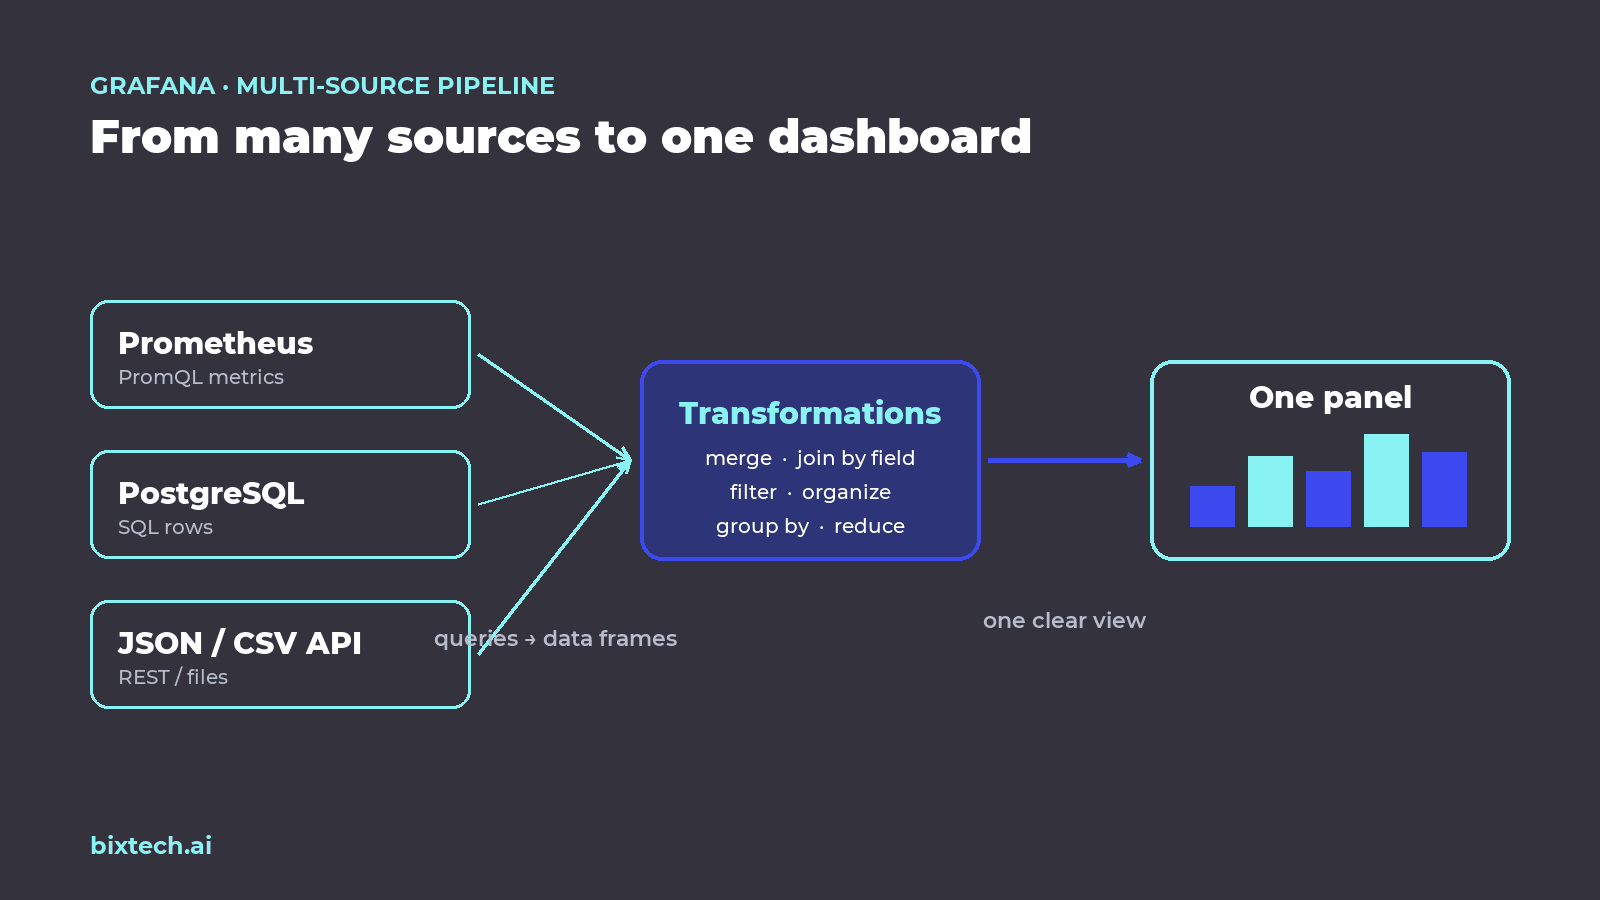
The stages are worth naming, because you will debug against them constantly on any observability setup:
- Data source plugin connects Grafana to a system such as Prometheus, PostgreSQL, Elasticsearch, or BigQuery, with more than 150 sources and plugins available.
- Query fetches data from that source, for example SQL, PromQL, or a REST request.
- Data frame is Grafana's internal format that captures rows, fields, and types, the common shape every source is normalized into.
- Transformations are optional, SQL-like operations that reshape and combine one or more data frames.
- Visualization is the panel, a time series, table, geomap, or bar chart, that renders the result.
Think of transformations as a safe workspace layered on top of your data pipelines. They rearrange and combine what has already been queried, without touching the underlying data. That separation is the key mental model for everything below.
How to combine multiple data sources in one dashboard {#combine}
Combining Grafana dashboards with multiple data sources starts inside a single panel. You are not limited to one query, and how the results appear depends on the visualization you choose. This is the same layered thinking that shows up in a well-built metrics layer.
Run several queries in one panel
Open a panel, go to the Queries section, and build Query A. Then click Add query for Query B, C, and so on, giving each a clear alias so you can reference it later in transformations and legends. A name like api_error_rate is far easier to reason about than A, and it pays off the moment you start joining, the same way clean naming pays off across any data engineering workflow.
What happens next depends on the panel. A time series naturally plots multiple results at once as separate lines. A table often shows one data frame at a time until you consolidate the frames with transformations, which is exactly what the next section covers, and where most BI teams spend their tuning time.
Choose the right way to combine frames
Once you have several frames, two operations carry most of the work: Merge when the schemas match, and Join by field when they share a key but differ in shape. Picking the wrong one is the most common source of confusion for teams new to multi-source dashboards, so it is worth being deliberate here.
Transformations reference: merge, join, and reshape {#transformations}
Transformations let you merge, join, filter, and reshape data frames without rewriting your queries. Order matters, so treat them as a pipeline: rename and alias first, then join, then filter and organize, then aggregate. Grafana documents the full catalog in its official transformations reference, and the table below covers the ones you will reach for on nearly every analytics dashboard.
| Transformation | What it does | Use it when |
|---|---|---|
| Merge (union) | Stacks rows from frames that share the same columns | Appending identical datasets, such as monthly partitions or per-region slices |
| Join by field | SQL-style join of frames on a shared key | Schemas differ but share id, host, or iso_country |
| Filter data by value | Keeps only rows matching a condition | status = 'error' or airport_type = 'large_airport' |
| Convert field type | Fixes strings vs numbers, or epoch to time | Join keys or timestamps arrive as the wrong type |
| Group by | Aggregates rows | Sum by region, average by service |
| Reduce | Collapses a series into a single value | Stat panels showing last, max, or 95th percentile |
| Organize fields by name | Renames, reorders, or hides fields | Cleaning up qualified names like product_name (A) |
Merge when schemas match
Use Merge when your frames have the same columns and you simply want to stack the rows. Two queries returning time, region, and requests become one table or time series containing the union of both. Go to the Transformations tab, add Merge, and Grafana combines the frames by matching columns. This is the lightest operation available, which is why it scales well even on busy observability boards.
Join by field for SQL-style joins
Use Join by field when schemas differ but share a key. Say Query A returns product metadata and Query B returns release info, both keyed by id. Add the Join by field transformation, select id as the key, and choose the join type. Grafana may qualify column names as product_name (A), so follow the join with Organize fields by name to rename and tidy, a habit that keeps BI dashboards readable.
Join type is a decision, not a default. The choice controls which rows survive, and for sparse time series data it changes the entire shape of the result:
| Join type | Keeps | Best for |
|---|---|---|
| Inner | Only rows with a match on both sides | Strict correlation, dropping unmatched noise |
| Left / Right | All rows from one side, matched from the other | Enriching a primary table with optional metadata |
| Outer | All rows from both sides, nulls where unmatched | Sparse time series where gaps are meaningful |
Mixing data sources and formats in one panel {#mixed}
The Mixed data source is what lets a single panel query more than one system, even when they return different formats such as JSON, CSV, or SQL results. You add queries from different sources, then join or merge them with transformations. Grafana's data source documentation lists everything a panel can talk to, and the pattern below is the one behind most cross-source dashboards.
A concrete walkthrough shows how the pieces fit. Set the panel data source to Mixed, then build two queries that get aligned before they meet, the same alignment logic used across any data mesh or lakehouse design:
Panel data source: Mixed

            alias the two-letter code field  Code2 → iso

            returns an  iso_country  field

  1. Organize fields by name   → rename Code2 to iso (Query A)
                                → rename iso_country to iso (Query B)
  2. Join by field             → key: iso  (inner)
  3. Filter data by value      → airport_type = 'large_airport'
The result is one map panel showing the world's largest airports in the countries returned by Query A. The Infinity plugin, listed in Grafana's official plugin catalog, is what reads JSON and CSV from the web here. Two cautions apply, and both matter as much on internal APIs as on public ones feeding your modern data stack. Mixed does not mean unlimited, since large joins across remote APIs get slow, so filter and pre-aggregate at the source. And when queries use different key names such as iso and iso_country, rename them to match before the join.
Performance and scalability best practices {#performance}
Multi-source dashboards are powerful, and they degrade the moment you pull too much data into Grafana and reshape it there. The rule that saves most dashboards is simple: push work down to the source. Filter and aggregate in the query, pull only the fields and time range you need, and let the database do what databases are built for, the same principle behind query cost optimization.
Grafana's macros make that push-down align with the dashboard itself. Using $__timeFilter() and $__interval ties your query window and sampling to the active time picker, so you never over-fetch, a pattern that carries straight over to any in-database compute approach:
-- Push filtering, sampling, and aggregation to the database
SELECT
  $__timeGroup(created_at, $__interval) AS time,
  region,
  COUNT(*)                              AS requests
FROM api_events
WHERE $__timeFilter(created_at)         -- align to the dashboard time range
  AND status = 'error'
GROUP BY time, region                   -- pre-aggregate before it hits Grafana
ORDER BY time;
A handful of habits keep boards responsive as they grow, and they compound with the lineage and traceability you already track:
- Limit cardinality and rows with
WHERE,LIMIT, andGROUP BYat the query level, then trim further with Filter and Reduce. - Align time zones and timestamp types across sources, converting epoch values to time fields so comparisons are honest.
- Avoid fan-out joins, where a non-unique key multiplies rows, by de-duplicating or aggregating keys before the join.
- Prefer a service layer for very large web datasets, one that supports filtering and paging, instead of fetching everything and filtering in Grafana.
- Debug with Explore and Query Inspector to see raw frames, query timings, and payload sizes, and find the slow query fast.
One more rule stands apart, because it trips up experienced teams. Keep alerts simple. Alerting engines are optimized for single-source, directly queryable metrics, so avoid relying on complex panel transformations for alerts. Compute a single, alert-ready metric at the source or through expressions designed for alerts, and your alerting stays trustworthy as the dashboard evolves.
Modeling keys and schemas for clean joins {#keys}
Clean joins start with clean keys, and that is a modeling decision you make before you build panels. Standardize key names across systems, so service_id, iso, and hostname mean the same thing everywhere, the same governance mindset a semantic model enforces at the metrics layer.
Three conventions prevent most join failures downstream. Normalize casing and format, for example always uppercase ISO codes and trim whitespace from IDs. Cast types so both sides use the same string or integer type. And derive keys when a source does not provide one natively, using Organize fields by name, Convert field type, or Add field from calculation, a small investment that keeps your data architecture joinable as it grows.
Building panels teams can trust {#trust}
Clear panels make multi-source dashboards usable by people who did not build them. Configure units such as ms and %, set thresholds and value mappings, and name queries descriptively like api_latency_p95 or orders_per_min, so values explain themselves the way a good BI report does. Documentation belongs on the panel too: a short description of the sources, join keys, and filters is what future teammates thank you for.
Variables are what make a dashboard reusable instead of a one-off. They turn a single board into a template that serves many teams and environments, which is exactly how mature BI teams scale a dashboard across an organization:
- Data source variables let viewers switch between clusters or environments, such as prod, stage, and dev, that share a schema.
- Query variables populate lists like team, region, or service straight from your data, then parameterize the queries.
- Chained variables filter one variable by another, for example services filtered by the selected team.
Multi-source usually means multi-team, so governance is part of the build, not an afterthought. Scope access with folders, roles, and data source permissions, keep API keys and tokens in the data source configuration rather than in panel text, and vet every plugin before installing it. Version-control your dashboards by exporting the JSON model or using provisioning, the same traceability discipline you apply to pipelines, so you can review changes and roll back.
Real-world patterns you can reuse {#patterns}
Patterns make the theory concrete, and each one below joins across sources for a reason a business would recognize. For every pattern, pre-aggregate at the source and keep the join narrow, with few columns and small row counts, the same restraint that keeps licensing and compute costs under control.
| Pattern | Sources joined | Join key | What it reveals |
|---|---|---|---|
| Operational + business KPI | SQL order volume + Prometheus API latency | time bucket | How performance affects conversion |
| Infra + ownership | Host metrics + CMDB in PostgreSQL | hostname | Which teams own the noisiest machines |
| Geospatial status board | Incident JSON API + site CSV | site id | Active outages on a Geomap |
| SLO rollups | Per-service error rates + services table | service_id | Owners and on-call next to each SLO |
The SLO rollup is a good example of transformation order in action. You use Group by and Reduce to compute a per-service error rate, then Join by field with a services table to attach owners and on-call rotations, so a single view answers both what broke and who to call. That kind of composition is where multi-source Grafana earns its place next to your data engineering tooling.
Troubleshooting common pitfalls {#troubleshooting}
Most multi-source issues have the same handful of causes, and naming them turns a frustrating afternoon into a five-minute fix. The table maps each symptom to its cause and remedy, and it reflects the debugging flow behind most production dashboards.
| Symptom | Likely cause | Fix |
|---|---|---|
| Cannot select a join key | Fields do not share a name | Alias or rename one side first |
| The table exploded in size | A many-to-many (fan-out) join | Aggregate or de-duplicate keys before joining |
| Types do not match | String vs number mismatch | Convert field type, or CAST(id AS TEXT) in the query |
| Timestamps look wrong | Time zone or epoch mismatch | Align time zones, convert epoch to time |
| The panel is slow | One heavy query | Use Query Inspector, add LIMIT / WHERE / GROUP BY |
| The map shows nothing | Lat/long not numeric or unmapped | Check field types and panel field mappings |
| Alert did not fire | Alerts skip panel transformations | Compute an alert-ready metric at the source |
The pattern across every row is the same lesson from the performance section: shape data early, at the source, so the panel only renders. Teams that internalize that spend far less time in Query Inspector and far more time acting on what the dashboard tells them.
A quick build checklist {#checklist}
Before you share a multi-source board widely, run it against a short list. Define the decision the panel supports, identify the join keys and field names across sources, and filter and aggregate at the source first. Use Mixed only when you genuinely need cross-source results, add queries with clear aliases, and apply transformations in a logical order. Set units, thresholds, and value mappings, then test with different time ranges and variable selections before inspecting performance and refining queries, the same rigor you would apply to any analytics deliverable.
Working with Grafana dashboards with multiple data sources is a genuine advantage when you treat joining as an engineering discipline rather than a drag-and-drop afterthought. Bring in several queries per panel and label them clearly, use transformations to merge or join frames while aligning keys, and push filtering and aggregation down to the source so the board stays fast. Standardize schemas, handle types and time zones deliberately, and document your panels, and the many sources feeding your organization finally resolve into one clear picture.
If your team is unifying observability, product, and business data into dashboards people actually trust, our specialists can help you design the architecture, model the join keys, and keep every board fast as it scales. Talk to our team and move your data maturity forward. ⬇️

FAQ {#faq}
How do you combine multiple data sources in one Grafana panel? Set the panel data source to Mixed, then add one query per source and give each a clear alias. Use transformations to align them: Join by field on a shared key when schemas differ, or Merge when they match. Filter at the source first so the panel stays fast.
What is the difference between Merge and Join by field in Grafana?
Merge stacks rows from frames that already share the same columns, so it is a union for identical schemas. Join by field is a SQL-style join that combines frames on a shared key such as id or hostname, and it is what you use when the schemas differ but relate through a common field.
Why is my multi-source Grafana dashboard slow?
The usual cause is pulling too much data into Grafana and reshaping it there. Push work down to the source by filtering and aggregating in the query, use the $__timeFilter() macro to bound the time range, and avoid fan-out joins on non-unique keys. Use Query Inspector to find the single slow query.
Can Grafana join data from different formats like SQL, JSON, and CSV? Yes. The Mixed data source lets one panel query SQL, JSON, and CSV sources together, and plugins such as Infinity read JSON and CSV from the web. Normalize the key names and types with transformations before you join, and pre-aggregate remote data at its source to protect performance.
Should I use Grafana transformations for alerting? Generally no. Alerting engines are optimized for single-source, directly queryable metrics, and they do not apply panel transformations. Compute a single, alert-ready metric at the source or through expressions designed for alerts, and keep complex cross-source joins in the visualization layer where they belong.